
Descrição
Principais Características
- Stop Dinâmico Baseado em ATR: Adapta automaticamente a distância do stop móvel à volatilidade atual do mercado - mais amplo em condições voláteis, mais apertado em mercados calmos
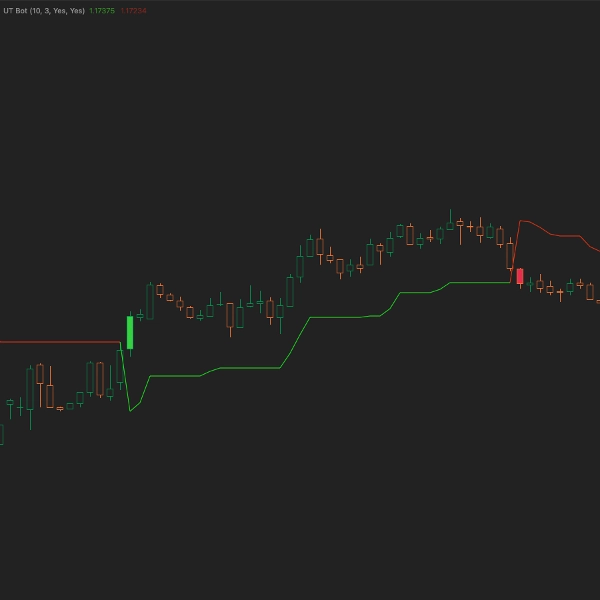
- Sinais Visuais Claros: Banda lima para tendência de alta, banda carmesim para tendência de baixa - identifique a direção da tendência rapidamente sem poluir seu gráfico
- Alertas Opcionais: Ative notificações pop-up e alertas sonoros para ficar informado sobre mudanças de tendência mesmo quando estiver longe da tela
- Coloração das Barras nos Sinais: As barras mudam de cor instantaneamente na reversão da tendência, dando confirmação visual quando o preço cruza o nível do stop móvel
Como Funciona
O UT Bot calcula um stop móvel baseado no Período ATR multiplicado pela sua configuração de Sensibilidade. Quando o preço está acima do stop, a tendência é de alta. Quando o preço cruza para baixo, a tendência reverte para baixa. O indicador acompanha essas transições e colore as barras para sinalizar possíveis entradas ou saídas.
O stop móvel só se move na direção da tendência - sobe durante tendências de alta e cai durante tendências de baixa, protegendo os ganhos enquanto permite que as operações tenham espaço para respirar.
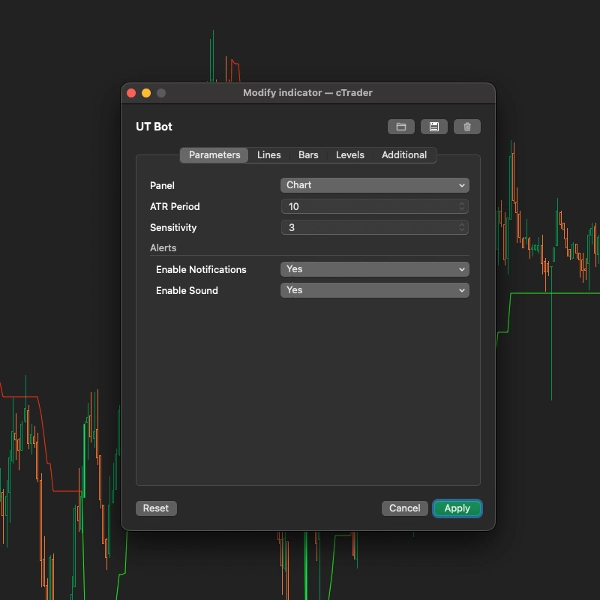
Parâmetros
Configurações Principais
- Período ATR (Padrão: 10): Número de barras usadas para calcular o Average True Range. Valores maiores = sinais mais suaves, porém mais lentos
- Sensibilidade (Padrão: 3.0): Multiplicador para a distância do ATR. Valores maiores criam um stop móvel mais amplo (menos sinais falsos, entradas mais tardias). Valores menores criam stops mais apertados (mais sinais, mais reversões falsas)
Configurações de Alerta
- Ativar Notificações (Padrão: Falso): Mostrar alertas pop-up quando a tendência mudar
- Ativar Som (Padrão: Falso): Tocar som quando a tendência mudar (som positivo para alta, negativo para baixa)
Ideal Para
- Traders de tendência que precisam de posicionamento dinâmico de stop loss
- Traders que desejam direção clara da tendência visualmente
- Aqueles que procuram um sistema mecânico de acompanhamento de tendência
- Scalpers a traders de swing (ajuste a Sensibilidade conforme necessário)
Dicas
- Scalping: Use Período ATR 5-7, Sensibilidade 1.5-2.0 para sinais mais rápidos
- Swing Trading: Use Período ATR 10-14, Sensibilidade 3.0-4.0 para menos sinais falsos
- Confirmação: Combine com volume ou outros indicadores para entradas de maior probabilidade
Resumo
Key functionalities include detecting bullish and bearish momentum shifts when price crosses the trailing stop, visually signaling these reversals by coloring bars green for bullish flips and red for bearish flips, and drawing adaptive trailing stop bands above or below price. The indicator is non-repainting and overlays directly on the chart for immediate insight.
Users can customize core parameters such as ATR period (default 10) and sensitivity (default 3), and enable optional popup and sound alerts for trend changes. UT Bot is suitable for various markets including Forex, indices, and cryptocurrencies like BTCUSD and XAUUSD. It is recommended to use UT Bot alongside trend filters or volume indicators to enhance confirmation in trending or breakout environments.
Avaliações de clientes
5 | 67 % | |
4 | 33 % | |
3 | 0 % | |
2 | 0 % | |
1 | 0 % |


