
Ichimoku Kinko Hyo
Gösterge
155 i̇ndirmeler
Sürüm 1.0, Jul 2025
Windows, Mac
5.0
Değerlendirmeler: 1
Açıklama
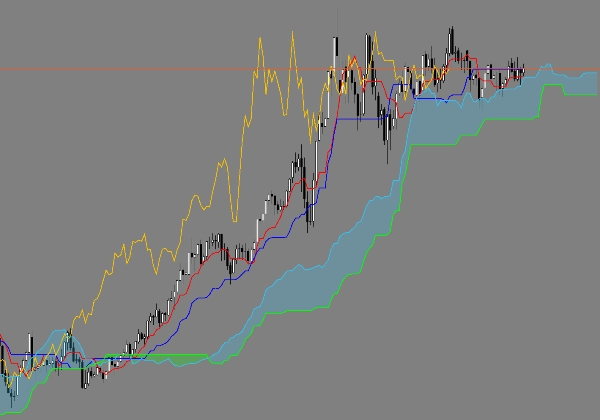
Bu, cTrader için düzeltilmiş bir Ichimoku Kinkō Hyō göstergesidir. Varsayılan olarak, cTrader’ın yer değiştirmesi 26’dır ve sıfırdan saymaya başlar, bu da Chikou Span ve Kumo (bulut) çizgilerinin yanlış kaydırılmasına neden olur. Bu sürüm, hem Chikou Span (25 dönem geriye taşındı) hem de Kumo çizgileri (25 dönem ileri taşındı) için sabit bir 25 dönemlik kaydırma kullanarak bu sorunu giderir; bu, orijinal Japon spesifikasyonu ve TradingView gibi platformlarla uyumludur. Bu, tüm Ichimoku çizgilerinin doğru pozisyonlarda hesaplanmasını ve çizilmesini sağlayarak doğru sinyaller ve analizler için garanti verir.
Özet
YZ özeti
This product is a corrected Ichimoku Kinkō Hyō indicator designed for the cTrader platform. It addresses an issue in cTrader’s default Ichimoku implementation, where the displacement is set to 26 and counted from zero, causing misalignment of the Chikou Span and Kumo (cloud) lines. This version applies a fixed 25-period shift: the Chikou Span is moved 25 periods backward, and the Kumo lines are shifted 25 periods forward. This adjustment aligns the indicator’s calculations and plotting with the original Japanese Ichimoku specification and other platforms like TradingView. The correction ensures that all Ichimoku lines are displayed in their proper positions, supporting accurate technical analysis and signal interpretation.
Gösterge profili
Müşteri değerlendirmeleri
5.0
Değerlendirmeler: 1
5 | 100 % | |
4 | 0 % | |
3 | 0 % | |
2 | 0 % | |
1 | 0 % |
Tartışma
SSS
cTrader Store üzerinden erişilebilen işlem botları, göstergeler ve eklentiler gibi ürünler, üçüncü taraf sağlayıcılar tarafından sağlanır ve yalnızca bilgilendirme ve teknik erişim amaçlarıyla sunulur. cTrader Store bir broker değildir ve yatırım tavsiyesi, kişisel öneriler vermez veya gelecekteki performansı garanti etmez.


!["Smart Money Concepts (SMC) [Iridio Capital]" logosu](https://cdn.ctrader.com/image/webp/28b69fd1-ef54-4bed-9487-07e78e883be4_40934)


Fiyat
Başlangıç 20/03/2025
155
Ücretsiz yüklemeler