
Rsi + Volume
Indicador
707 transferências
Versão 1.0, Mar 2025
Windows, Mac
5.0
Avaliações: 3
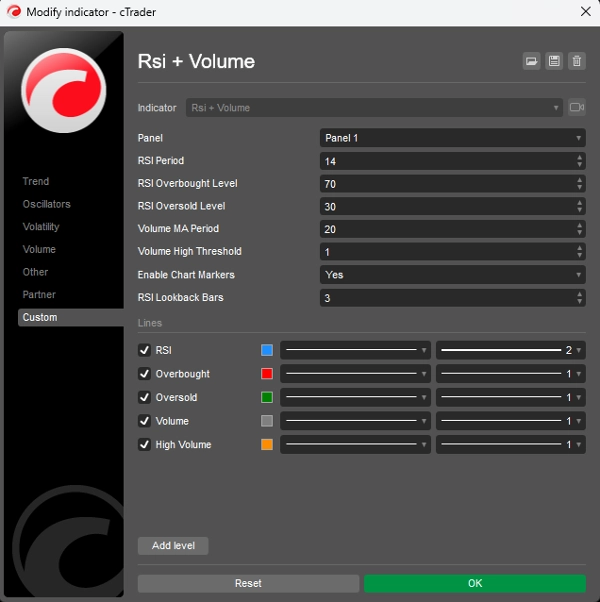
Este indicador combina o RSI (Índice de Força Relativa) com a análise de volume para gerar sinais de negociação mais confiáveis. Ele funciona com o princípio de que movimentos significativos de preço devem ser acompanhados por alto volume para confirmar a força do movimento.
Componentes Principais:
- Análise do RSI:
-
- Mede a velocidade e a mudança dos movimentos de preço em uma escala de 0-100
- Identifica condições de sobrecompra (acima de 70) e sobrevenda (abaixo de 30)
- Ajuda a identificar possíveis pontos de reversão no mercado
- Análise de Volume:
-
- Compara o volume atual com uma média móvel do volume recente
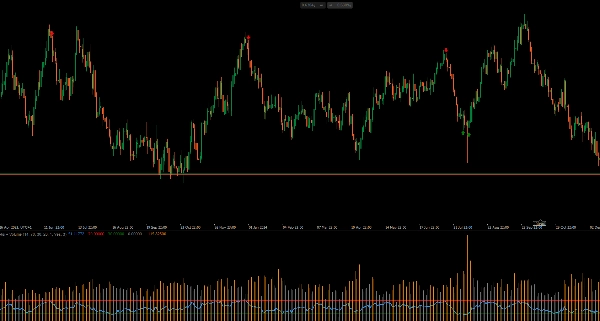
- Destaca períodos de alto volume (barras do histograma laranja)
- Confirma a força por trás dos movimentos de preço
- Geração de Sinais:
-
- Sinal de Compra: Quando o RSI cruza acima do nível de sobrevenda (30) com alto volume
- Sinal de Venda: Quando o RSI cruza abaixo do nível de sobrecompra (70) com alto volume
- Sinais visuais aparecem diretamente no gráfico (setas verdes para cima para compra, setas vermelhas para baixo para venda)
Como Usá-lo:
- Procure sinais de compra quando o preço estiver em tendência de baixa e o RSI mostrar condições de sobrevenda
- Procure sinais de venda quando o preço estiver em tendência de alta e o RSI mostrar condições de sobrecompra
- Volume mais alto confirma a força do sinal
- Ajuste os parâmetros (período do RSI, limite de volume) para corresponder ao seu intervalo de negociação
Este indicador ajuda a filtrar sinais falsos exigindo tanto a confirmação do RSI quanto volume acima da média, tornando-o mais confiável do que usar apenas o RSI.
Perfil do indicador
5.0
Avaliações: 3
5 | 100 % | |
4 | 0 % | |
3 | 0 % | |
2 | 0 % | |
1 | 0 % |
Avaliações de clientes
October 12, 2025
Hello, the RSI +volume indicator is perfect, but it needed to have something: when the little arrow appears on the chart, it could show a notification or an alarm. Would you be able to add that alarm or notification in cTrader?
August 12, 2025
Pros: Combines RSI and volume for stronger trading signals. Works well when RSI threshold intersects with high volume spikes. Lightweight and clear visuals. Cons: No alerts or tooltips. Lacks template saving. May generate noise on low-volume timeframes without additional filters.
Signal
Indices
RSI
Os produtos disponíveis através da cTrader Store, incluindo bots de negociação, indicadores e plugins, são fornecidos por programadores terceiros e são disponibilizados apenas para fins informativos e de acesso técnico. A cTrader Store não é um corretor e não fornece aconselhamento em matéria de investimento, recomendações pessoais ou qualquer garantia de desempenho no futuro.


Desde 21/02/2025
466.3M
Volume negociado
180.83K
Pips ganhos
21
Vendas
6.78K
Instalações gratuitas