present
Registe-se e receba 50 $ de desconto na sua primeira compra
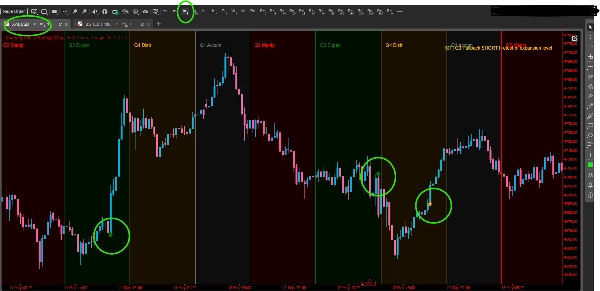
Trading product for QuarterlyTheoryStrategy Indicador Fair Value Gap BOS, image 1
QuarterlyTheoryStrategy
Indicador
107 transferências
Versão 1.0, May 2026
Windows, Mac
4.0
Avaliações: 2
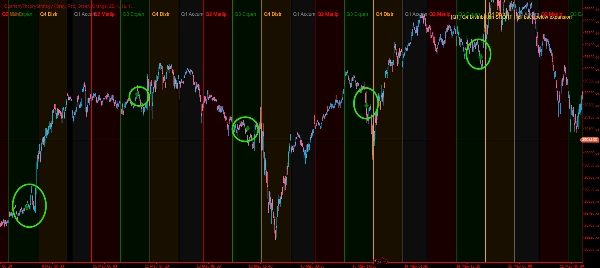
Trading product for QuarterlyTheoryStrategy Indicador Fair Value Gap BOS, image 2
Trading product for QuarterlyTheoryStrategy Indicador Fair Value Gap BOS, image 3
Desde 21/02/2025
466.3M
Volume negociado
180.83K
Pips ganhos
26
Vendas
7.43K
Instalações gratuitas

Descrição

Indicador Teórico Trimestral (ICT) — Zonas de Sessão & Sinais Inteligentes

O Indicador Teórico Trimestral traz o framework do ciclo de sessões ICT (Inner Circle Trader) diretamente para o seu gráfico cTrader. Baseado no conceito de que cada dia de negociação de 24 horas é dividido em quatro fases distintas de 6 horas, o indicador identifica e visualiza automaticamente:

  • Q1 – Acumulação (18:00–00:00 NY): Posições de dinheiro inteligente silenciosamente
  • Q2 – Manipulação (00:00–06:00 NY): Movimentos falsos & caça a stops
  • Q3 – Expansão (06:00–12:00 NY): O movimento direcional real
  • Q4 – Distribuição (12:00–18:00 NY): Realização de lucros & reversões


Principais Características

Fundos das Zonas de Sessão Cada trimestre é sombreado com uma cor de fundo totalmente personalizável e rotulado diretamente no gráfico. Cores, opacidade e espessura da borda são todos ajustáveis. As zonas atualizam dinamicamente ao rolar e dar zoom.

4 Sinais Inteligentes de Entrada

  • Caça a Stops Q2 — detecta varreduras das máximas/mínimas do Q1 que fecham de volta dentro, sinalizando uma reversão armadilha
  • Entrada de Expansão Q3 — dispara quando o preço rompe o intervalo do Q2, marcando o verdadeiro movimento direcional
  • Entrada de Retração Q3 — identifica retestes do nível de rompimento da expansão para entradas de menor risco
  • Distribuição Q4 — alerta quando o preço cruza de volta pelo nível de expansão durante a fase de distribuição

Cada sinal é desenhado como uma seta direcional (↑↓) diretamente na barra do gráfico onde a condição é atendida.

Alertas Integrados Quando executado em uma barra ao vivo, o indicador emite um som e exibe uma mensagem na tela para qualquer sinal disparado — sem necessidade de monitoramento manual.

Controle de Desempenho Um parâmetro configurável Dias para Mostrar (1–60 dias) limita o quão longe para trás as zonas e sinais são desenhados, mantendo o uso de RAM baixo mesmo em timeframes de alta frequência.

Alinhamento da Sessão NY Suporta ambos os fusos EST (UTC−5) e EDT (UTC−4), garantindo limites de zona precisos independentemente do horário do servidor do seu corretor.

Resumo

AI summary
The Quarterly Theory Indicator (ICT) integrates the Inner Circle Trader session cycle framework into cTrader charts by dividing each 24-hour trading day into four color-coded 6-hour zones: Q1 Accumulation (18:00–00:00 NY), Q2 Manipulation (00:00–06:00 NY), Q3 Expansion (06:00–12:00 NY), and Q4 Distribution (12:00–18:00 NY). Each zone is visually distinguished with customizable background colors, opacity, and borders that update dynamically with chart navigation.

The indicator provides four smart entry signals directly on the chart as directional arrows: Q2 Stop-Hunt (detects false breakouts within Q1 highs/lows), Q3 Expansion Entry (signals breakout from Q2 range), Q3 Pullback Entry (identifies retests of breakout levels), and Q4 Distribution (alerts on price crossing back through expansion levels). These signals include real-time alerts with sound and on-screen messages when conditions occur on live bars.

Additional features include a configurable "Days to Show" parameter to limit historical data display for performance optimization and support for both EST and EDT time offsets to align session zones accurately with New York time. The indicator is tagged with market structure concepts such as Fair Value Gap, Break of Structure, and Liquidity Sweep, and outputs visualizations, signals, and filters based on bar data.
Perfil do indicador
Categoria do indicador
Estrutura do mercado (SMC)
Tipo de resultado
Visualização
Sinais
Filtro
Requisitos de dados
Apenas barras
Sinais suportados
Quebra de nível
Toque no nível
Quebra

Avaliações de clientes

4.0
Avaliações: 2
5
0 %
4
100 %
3
0 %
2
0 %
1
0 %
Avaliações de clientes
September 10, 2026
QuarterlyTheoryStrategy is a clear ICT-style session-cycle indicator that divides the trading day into Q1 Accumulation, Q2 Manipulation, Q3 Expansion and Q4 Distribution zones and adds configurable directional signals. Testing on EURUSD and XAUUSD confirmed the four-zone structure and Q3 Pullback signals in both LONG and SHORT directions. The main reservations were one instance of missing zone backgrounds on EURUSD H1 and label crowding on wider H1 views.
May 27, 2026
Very useful, minor improvements needed Great tool that delivers consistent signals in trending markets. It struggles a bit in choppy or sideways conditions, but that's true for most indicators. Once you understand its strengths and pair it with proper risk management, it becomes a powerful part of your strategy.

Conversa

Perguntas frequentes

Fair Value Gap
BOS
Liquidity Sweep
Os produtos disponíveis através da cTrader Store, incluindo bots de negociação, indicadores e plugins, são fornecidos por programadores terceiros e são disponibilizados apenas para fins informativos e de acesso técnico. A cTrader Store não é um corretor e não fornece aconselhamento em matéria de investimento, recomendações pessoais ou qualquer garantia de desempenho no futuro.

Mais deste autor

Indicador
RSI
Forex
+4
High-probability trading signals in the fast-paced world of forex and CFD trading.
Indicador
Prop
Stocks
+4
High-Performance Renko Chart Indicator with Advanced filtering method - built for Renko and candlestick charts.
Indicador
ATR
MSS
+5
Detects ICT Turtle Soup setups — liquidity sweeps with MSS confirmation, ATR filter & kill zone session filter.
Indicador
SMC
Prop
+15
Automatic Elliott Wave Detection with Professional Filters
Indicador
Fibonacci
Key Levels
DailyTargets: Dynamic ADR-based levels & targets. Includes Buy/Sell zones, previous Hi/Lo, and automated trend alerts.
Indicador
EMA
RSI
+2
Advanced TDI indicator with Shark Fin signals, chart arrows, MTF RSI, divergence detection and smart alerts.
Indicador
Key Levels
Order Block
+3
Marks NY session range, detects wick sweeps beyond box edges.. One signal per day. Overlay, no repainting!
Indicador
MACD
Key Levels
+2
Trend indicator with multi-timeframe filters, generating signals only on fully completed bricks & candles. No Repaint.
Indicador
Key Levels
Supertrend
+3
Marks London and New York session opening zones and alerts you instantly on breakouts.
cBot
EMA
SL Manager
+5
Fully automated dual-symbol hedging cBot for cTrader.
20.6%
ROI
8.66
Fator de lucro
Indicador
Volume
Key Levels
KasePeakOscillator: Advanced volatility-adjusted momentum tool with automated peak detection and divergence alerts.
cBot
RSI
Aggressive
automates entries based on the RSX indicator — a smoothed, low-lag variant of the classic RSI.
1.67
Fator de lucro

Também poderá gostar de

Indicador
BOS
MSS
+3
Advanced indicator to highlight key execution context and help aligning structure, location, and risk.
Indicador
ATR
Volume
+2
Heatmap Liquidity Zones Visualize volume-at-price, uncover hidden support/resistance, and track market liquidity in real
Indicador
MACD
Crypto
A simple tool to control market sessions. fixed the display on the weekend.
Indicador
Pin Bar
Inducement
+5
Institutional Nasdaq Session Liquidity Map with Live Point HUD, Sweep Alerts & Interactive Playbook.
Indicador
ADX
ATR
+2
GOLD SENTINEL v1.0 - A CANDLE-COLORING INDICATOR FOR GOLD.
Indicador
RSI
Breakout
+1
🔍 Automatically detect support and resistance levels based on "swings" or pivots
Indicador
Supertrend
Moving Average
Easy Trade: Trend & Breakout Indicator for cTrader
Indicador
ATR
RSI
+1
Super Trend Rsi ,ATR + trend change distance + dynamic Alpha, divergence/convergence
Indicador
Auto Fibonacci Retracement Indicator.
Indicador
EMA
SMA
+2
Exhaustion Hunter by BeyondTrading — When price hits the limit, the reversal is next.
Indicador
MSS
Volume
+3
Rejection-based volume profile with tiered heat zones, POC levels and a fully draggable anchor on cTrader.
Indicador
Forex
Indices
+1
Detects HTF bias using CRT, Expansion & Swing Point patterns with SMT/PSP divergence — visualised in a floating candle
Indicador
VWAP
Volume
+4
Volume Profile + VWAP with Standard Deviations
Indicador
Block Liquidity,indicator.Block Order, Liquids Stops, Signal Sentiment,signal correctio.
Indicador
Doji
Volume
+5
Instantly spot high-liquidity institutional moves with clean, non-obtrusive triangle alerts on cTrader charts.
Indicador
Forex
Crypto
+2
Market Structure Indicator – Your Trading Map in a Noisy Market. No more Panicking Which one, Where, Why and How.
Indicador
ATR
RSI
+6
📊Zones Supply & Demand: Identifies key price levels with high volume concentration, marking Supply/Demand Zones & Marke
Indicador
Forex
BTCUSD
+5
INDICATOR,LIQUIDITY POOLS,ACCURATE SIGNAL, NO DELAY,80% PROBABILITY

Preço

Desde 21/02/2025
466.3M
Volume negociado
180.83K
Pips ganhos
26
Vendas
7.43K
Instalações gratuitas