
Sniper Zone Pro
Indicador
3 compras
Versão 1.0, Jan 2026
Windows, Mac
4.6
Avaliações: 3
Descrição
Indicador Sniper Zone Pro
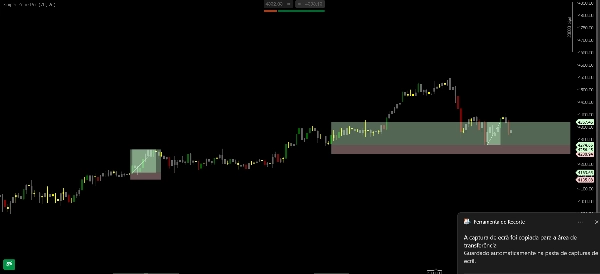
O Sniper Zone Pro é uma ferramenta avançada de análise projetada para identificar visualmente a pegada de grandes instituições no gráfico de preços. Ele combina o mapeamento de zonas de indecisão passadas com um sistema de coloração de velas que expõe movimentos de manipulação e força institucional. O indicador transforma o caos do mercado em regiões operacionais claras, permitindo que os traders identifiquem exatamente onde o preço "lutou" e onde tende a testar antes de uma nova expansão.
Principais Características do Sniper Zone Pro
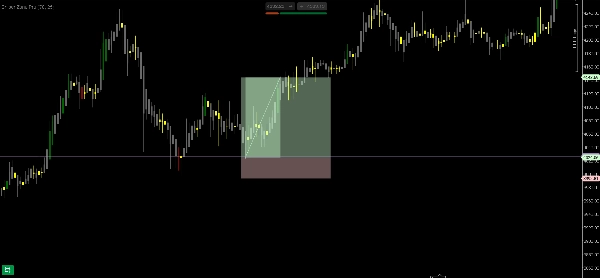
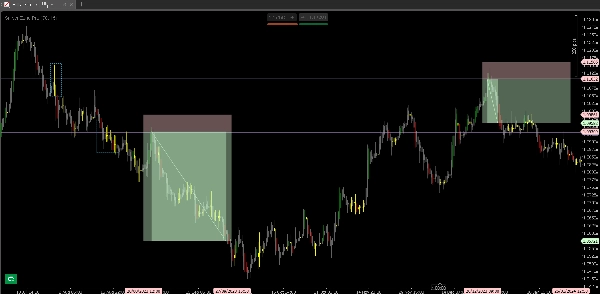
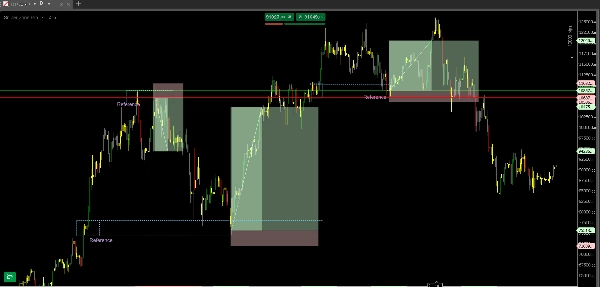
- Mapeamento de "Zonas de Batalha": Identifica automaticamente áreas de indecisão onde o preço acumulou volume. Essas regiões tornam-se "zonas operacionais" cruciais, pois representam níveis de preço com disputas significativas entre compradores e vendedores.
- Coloração Institucional Ativa: O sistema de cores não é meramente estético; ele destaca velas com características de movimento institucional (como alto volume ou absorção), separando o ruído do mercado das intenções dos grandes players.
- Zonas de Teste de Alta Probabilidade: Ao atingir uma região chave, o indicador ajuda a visualizar se o preço está apenas testando a zona ou está pronto para romper, oferecendo gatilhos de entrada muito mais precisos.
- Filtro de Hierarquia (HTF): Prioriza zonas de interesse em time frames superiores, onde as batalhas de preço têm maior relevância técnica e o potencial de retorno é significativamente maior.
Por Que Usar o Sniper Zone Pro?
- Leitura da Intenção do Mercado: Ao observar as cores das velas dentro das zonas de batalha, os traders podem identificar se as instituições estão defendendo essa posição ou a abandonando.
- Definição de Zonas Operacionais: Elimina a dúvida de "onde operar". O indicador mostra que as melhores oportunidades não são encontradas no meio de um movimento, mas sim nos testes de regiões onde o preço demonstrou indecisão anteriormente.
- Redução da Subjetividade: Os traders param de tentar "adivinhar" topos e fundos e começam a operar com base em áreas comprovadas de interesse profissional.
Resumo
Resumo de IA
Sniper Zone Pro is an advanced trading indicator designed to visually identify institutional activity on price charts by mapping past indecision zones and applying a candle coloring system that highlights market manipulation and institutional strength. It automatically detects "battle zones" where price accumulated volume, marking key operational areas of buyer-seller disputes. The indicator’s color-coded candles reveal institutional movements such as high volume or absorption, helping traders distinguish significant market actions from noise. It also highlights high-probability test zones, indicating whether price is testing or ready to break through these critical levels. A hierarchy filter prioritizes zones from higher timeframes, emphasizing areas with greater technical relevance. Sniper Zone Pro supports multiple markets including Forex, cryptocurrencies, stocks, commodities, and indices, with tags referencing symbols like BTCUSD, EURUSD, GBPUSD, XAUUSD, NAS100, and USDJPY. The tool aids traders in reading market intent by showing institutional defense or abandonment of price levels, defining precise operating zones to reduce subjectivity, and focusing trading decisions on professional interest areas rather than arbitrary price points.
Perfil do indicador
Avaliações de clientes
4.6
Avaliações: 3
5 | 67 % | |
4 | 33 % | |
3 | 0 % | |
2 | 0 % | |
1 | 0 % |
Avaliações de clientes
January 19, 2026
The best part is random clicks become easier to catch, and a 1R exit plan makes review easier.
January 14, 2026
H1 makes the signal less noisy, and it adds a useful layer without forcing action.
January 5, 2026
No reason to yolo this live without a few normal sessions. The result needs a journal.
Conversa
Perguntas frequentes
BTCUSD
Forex
Signal
Breakout
Indices
EURUSD
Commodities
GBPUSD
NZDUSD
Scalping
Crypto
Stocks
XAUUSD
NAS100
USDJPY
Os produtos disponíveis através da cTrader Store, incluindo bots de negociação, indicadores e plugins, são fornecidos por programadores terceiros e são disponibilizados apenas para fins informativos e de acesso técnico. A cTrader Store não é um corretor e não fornece aconselhamento em matéria de investimento, recomendações pessoais ou qualquer garantia de desempenho no futuro.


Preço
Desde 11/07/2025
3
Vendas