Descrição
Média móvel baseada em eficiência que ajusta dinamicamente a velocidade de suavização com base nas condições do mercado.
Calcula a suavização via Razão de Eficiência (movimento direcional vs. volatilidade total), respondendo rapidamente em tendências e achatando durante ruídos para evitar falsos sinais.
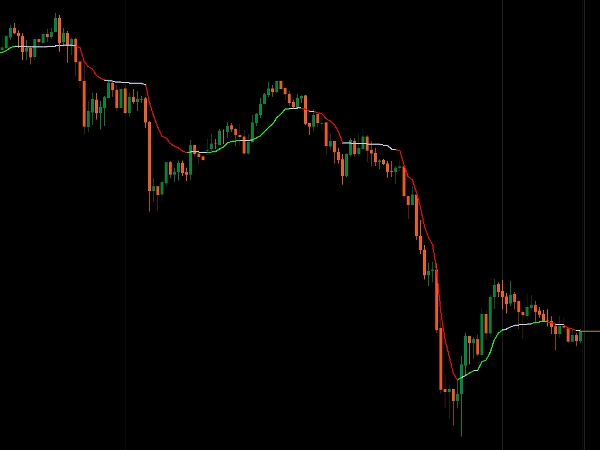
Visualização de cor em três estados (Verde para tendência de alta, Vermelho para tendência de baixa, Azul Claro para mercado lateral), parâmetros de sensibilidade configuráveis (Período, suavização rápida/lenta, limiar ER), troca automática entre modos rápido e lento, e comportamento dinâmico de suporte/resistência fornecem acompanhamento adaptativo de tendências para traders que precisam de responsividade em mercados direcionais e estabilidade durante consolidação.
RECURSOS
Algoritmo Adaptativo
- A velocidade de suavização muda com base na Razão de Eficiência (ER) — a razão entre movimento direcional e volatilidade total
- Responde rapidamente quando a eficiência aumenta
- Achata quando o preço está volátil para evitar falsos sinais
- Distância dinâmica do preço baseada no comportamento do mercado
Visualização em Três Estados
- Verde: Forte tendência de alta (ER acima do limiar + em ascensão)
- Vermelho: Forte tendência de baixa (ER acima do limiar + em queda)
- Azul Claro: Mercado lateral/volátil (ER abaixo do limiar)
- Confirmação visual instantânea das condições do mercado
Sensibilidade Configurável
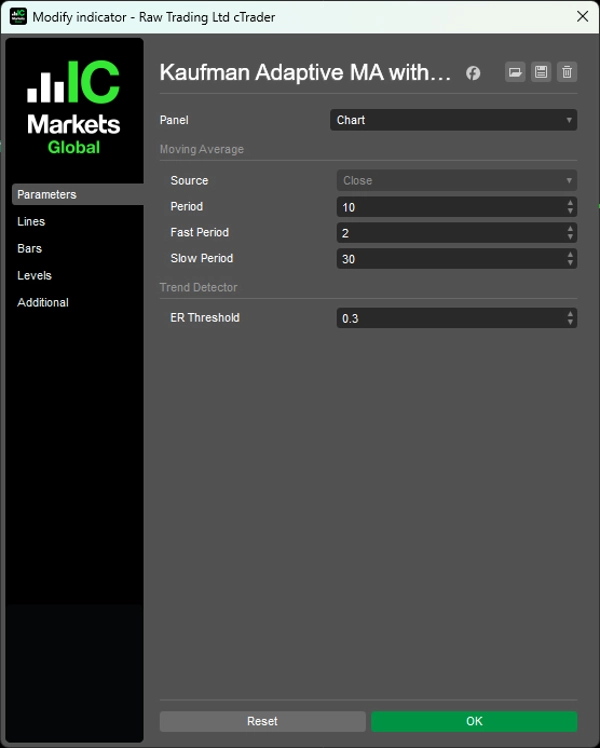
- Período: Retrospectiva para cálculo de eficiência (padrão: 10)
- Período Rápido: Suavização em tendências fortes (padrão: 2)
- Período Lento: Suavização em mercados laterais (padrão: 30)
- Limiar ER: Eficiência mínima para qualificar como tendência (padrão: 0,3)
Adaptação Inteligente
- Alterna automaticamente entre suavização rápida e lenta
- Filtra ruídos em mercados voláteis
- Captura tendências cedo quando as condições mudam
- Funciona como suporte/resistência dinâmico
__________________________________________________________________________________________
MAIS INDICADORES GRATUITOS
Explore uma ampla variedade de ferramentas de análise de mercado — desde estrutura e volume até regressão, volatilidade e períodos personalizados.
O código-fonte está disponível no repositório GitHub.
Todos gratuitos para uso. Mas se quiser enviar um suporte para café, você pode fazer isso aqui.
Suporte/Resistência
Volume
- Perfilador de Atividade de Volume
- Analisador de Eficiência de Volume
- Análise de Perfil de Volume
- Perfil de Volume - Atualizado
- Análise de Spread de Volume
- VWAP (Preço Médio Ponderado por Volume)
Médias Móveis
- Canal SSL
- Média Móvel Ancorada
- Média Móvel Escalonada por Desvio
- Ativador Gann High Low
- Linha de Tendência Instantânea
- Média Móvel Adaptativa Kaufman com Visão de Tendência
- Canal de Média Móvel
- Conjunto de Médias Móveis
- Média Móvel do Canal de Tendência
Utilitários/Personalizados
Baseado em Regressão
Volatilidade
Osciladores
__________________________________________________________________________________________
ISENÇÃO DE RESPONSABILIDADE
Negociar envolve riscos. Este indicador destina-se apenas à análise técnica — sempre aplique uma gestão de risco adequada e negocie com responsabilidade.
FEEDBACK E MELHORIAS
Se você tiver sugestões, pedidos de recursos ou ideias para melhorias, por favor deixe um comentário na aba Discussão. Seu feedback ajuda a melhorar o indicador para todos.
Resumo
Key features include a three-state color-coded visualization: green for strong uptrends, red for strong downtrends, and light blue for ranging or choppy markets, providing immediate visual insight into market states. Users can configure sensitivity parameters such as lookback period, fast and slow smoothing periods, and the ER threshold to tailor responsiveness.
The indicator automatically switches between fast and slow smoothing modes, adapting to changing market behavior. It also acts as a dynamic support and resistance tool, helping traders identify trend shifts early while filtering out noise in consolidation phases. This adaptive approach supports scalping and other trading strategies requiring both responsiveness and stability in directional and ranging markets.


![Logótipo de "[Stellar Strategies] Moving Averages Combined 1.0"](https://cdn.ctrader.com/image/webp/93692c9d-ac16-4dd8-ba83-5a62250c39a9_27250)