Logótipo de "Institutional Bubbles"
Indicador
6 compras
Versão 1.0, Apr 2026
Windows, Mac
4.5
Avaliações: 2
Imagem carregada de "Institutional Bubbles"
Desde 24/03/2026
8
Vendas
25
Instalações gratuitas

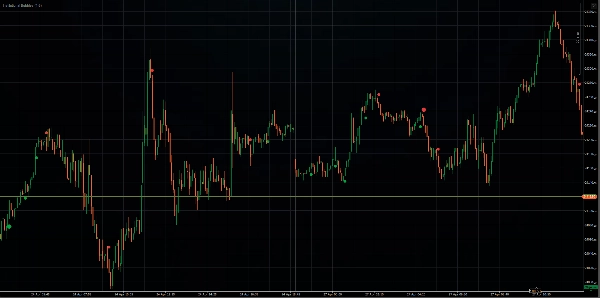
Institutional Bubbles foca na detecção da participação institucional.

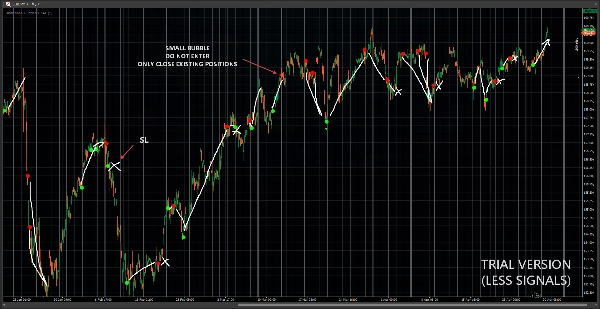
__ A atividade institucional varia com as condições de liquidez e o contexto do mercado. Para isso, o indicador aplica um algoritmo proprietário que combina uma normalização baseada em lambda com um VWAP móvel para isolar os padrões óbvios de desequilíbrio. O objetivo não é destacar e usar os sinais suspeitos óbvios, mas sim destacar e usar a atividade artificialmente "normal" e equilibrada. __

Este é um sistema totalmente quantificado. Fizemos backtest em outras plataformas e isso nos mostrou que seguir cegamente bolhas de grande porte produz uma vantagem consistente que foi validada em mais de 1000 negociações (o backtest segue a direção do sinal e fecha a posição se aparecer um sinal do lado oposto, nenhum filtro ou outro indicador foi usado). Com uma vantagem consistente em todos os símbolos, este indicador é perfeito para elevar sua estratégia a outro nível, dando-lhe mais confiança nas entradas.


* A CONFIGURAÇÃO PADRÃO (SENSIBILIDADE=1.6 OU MENOR) É A MELHOR PARA CADA SÍMBOLO.
* TODOS OS SÍMBOLOS E INTERVALOS DE TEMPO SÃO SUPORTADOS, MAS É RECOMENDADO USAR M1 OU M5 PARA A LEITURA MAIS PRECISA.

* NÃO VENDEMOS ALGORITMOS DE NEGOCIAÇÃO AUTOMÁTICA.

Perfil do indicador
Categoria do indicador
Suporte e resistência
Tipo de resultado
Visualização
Sinais
Filtro
Requisitos de dados
Apenas barras
Sinais suportados
Quebra
Inversão
Força da tendência
Volatilidade
Quebra de nível
Toque no nível
4.5
Avaliações: 2
5
50 %
4
50 %
3
0 %
2
0 %
1
0 %
Avaliações de clientes
May 4, 2026
Volume
Market Structure
Supply & Demand
VWAP
Support & Resistance
Os produtos disponíveis através da cTrader Store, incluindo bots de negociação, indicadores e plugins, são fornecidos por programadores terceiros e são disponibilizados apenas para fins informativos e de acesso técnico. A cTrader Store não é um corretor e não fornece aconselhamento em matéria de investimento, recomendações pessoais ou qualquer garantia de desempenho no futuro.

Mais deste autor

Indicador
OBV
Volume
+2
Weis Wave indicator based on the original work of David Weis.
Logótipo de "VA Footprint"
Bem avaliado
4.5
(4)
$50
/
$75
Indicador
SMC
Prop
+4
VA Footprint is HFT resistant, order flow chart that measures the true intent by every price level.
Indicador
Volume
Order Block
+4
Volume Profile with fixed period, custom range and buy/sell pressure.

Também poderá gostar de

Indicador
Supertrend
Adaptive MA anchored to structural trend changes — no fixed period. Dual Supertrend + swing detection.
Indicador
AI
ATR
+27
Market Cipher B
Indicador
Inside Bar
Save time by lighting a candle to look within yourself in another temporality
Indicador
Forex
cTrader Auto Support & Resistance detects key levels with Fibonacci analysis and sends real-time trading alerts.
Indicador
IVB 2.0 is an indicator that works on the strategy of imbalance of the maximum volatility box of indices
Indicador
AI
ATR
+9
Index Hunter: Momentum analysis for US30 & NAS100. Designed to identify high-velocity moves and intraday trends.
Indicador
ATR
SMC
+5
Candles Volume Delta is a powerful, visually intuitive indicator that transforms raw tick volume into actionable trading
Indicador
Key Levels
Supply & Demand
+2
Institutional Levels Pro is an essential tool for traders who rely on price action and institutional market structure.
Indicador
ATR
EMA
+3
The UTBot you know from TradingView — now on cTrader with confirmed signals, VWAP, EMA and session overlays.
Indicador
SMC
Prop
+12
Multi-TF FVG + Smart Fibonacci
Indicador
Forex
Crypto
+3
Perfect Trend
Indicador
Volume
Order Block
+4
Volume Profile with fixed period, custom range and buy/sell pressure.
Indicador
ATR
Forex
+5
Most used candle patterns. (1 candle, 2 candles and 3 candles patterns) and Marubozu. Bonus Fibo Risk control.
Indicador
The Weekly Daily Levels indicator shows the OHLC, and mid-point prices for the previous day and week.
Indicador
ATR
Volume
+2
Heatmap Liquidity Zones Visualize volume-at-price, uncover hidden support/resistance, and track market liquidity in real
Indicador
SMC
Prop
+11
Sessions PRO is a professional session visualization indicator - 4 Fully Customizable Sessions
Indicador
ATR
RSI
+6
Market structural patterns , specifically the concepts of Change of Character (ChoCH) 🔄 and Break of Structure (BoS) 💥
Indicador
AI
ATR
+27
Support and Resistance with signals
Desde 24/03/2026
8
Vendas
25
Instalações gratuitas