
Area of Interest
Indicador
2 compras
Versão 1.0, Aug 2025
Windows, Mac
4.0
Avaliações: 2
Descrição
1. Objetivo do Indicador
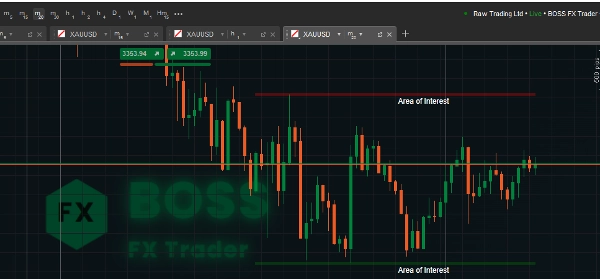
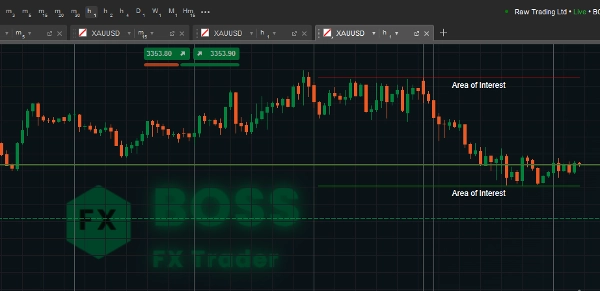
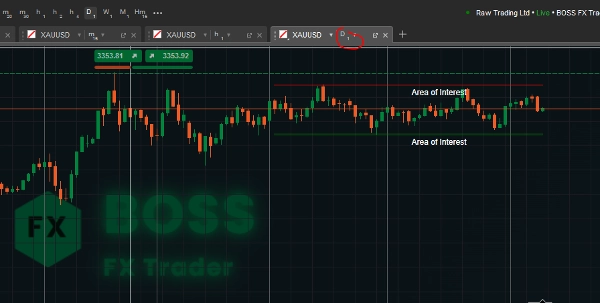
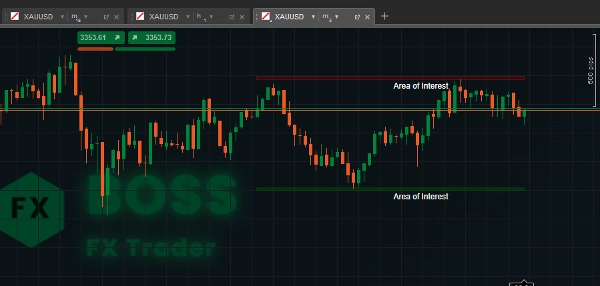
Este Indicador Área de Interesse do cTrader identifica zonas de suporte e resistência dentro de um período de análise definido pelo usuário, e as destaca visualmente como “Áreas de Interesse” no seu gráfico.
Ajuda os traders a ver rapidamente os níveis-chave de preço onde reversões ou rompimentos são mais prováveis de ocorrer.
2. Como o Código Funciona
- Período de Análise – O número de barras (velas) anteriores que o indicador irá escanear para encontrar a máxima máxima e a mínima mínima.
- Valores maiores → zonas mais amplas.
- Valores menores → níveis mais recentes.
- Altura da Zona – O tamanho vertical (espessura) da área de suporte/resistência em pips.
- Ajuda a tornar a zona mais visível e ajustável.
- Limpa desenhos antigos antes de traçar novos para evitar confusão.
- Coleta preços máximos e mínimos para o intervalo de análise.
- Encontra os níveis de preço mais altos e mais baixos (resistência e suporte).
- Converte a altura da zona de pips para valor real de preço.
3. Instruções de Uso
- Anexar o Indicador
-
- Abra o cTrader, carregue um gráfico, clique em Indicadores → Personalizado → AreaOfInterest.
- Ajustar Parâmetros
-
- Período de Análise:
-
- Para swing trading → Use valores maiores (ex.: 100–200).
- Para scalping → Use valores menores (ex.: 20–50).
- Altura da Zona: Ajuste conforme seu estilo de negociação e volatilidade do instrumento.
- Interpretando as Zonas
-
- Zona Vermelha (Resistência) – O preço tende a reverter ou desacelerar ao entrar nesta zona.
- Zona Verde (Suporte) – O preço frequentemente salta para cima a partir daqui.
- Procure por:
-
- Rejeição de preço
- Padrões de velas (pin bars, engulfing)
- Confluência com outros indicadores (EMA, RSI, Fibonacci)
- Exemplos de Negociação
-
- Negociação de Reversão: Entre comprado próximo à zona verde com um stop logo abaixo dela.
- Negociação de Rompimento: Espere os preços fecharem acima da zona vermelha para um rompimento de alta.
- Detecção de Falso Rompimento: Observe pavios além da zona mas fechando dentro dela (possíveis reversões).
Um trader lucrativo usou esta ferramenta.
Resumo
Resumo de IA
Area of Interest is a cTrader indicator designed to identify and visually highlight key support and resistance zones on trading charts. It scans a user-defined lookback period to detect the highest highs and lowest lows, marking these as “Areas of Interest” to help traders recognize price levels where reversals or breakouts are more likely. Users can adjust the lookback period to focus on broader historical zones or more recent price levels, and set the vertical size (zone height) of these areas in pips for better visibility. The indicator clears previous drawings before plotting new zones to maintain chart clarity. Resistance zones are displayed in red, indicating potential price reversals or slowdowns, while support zones appear in green, suggesting possible price bounces. Traders can use these zones alongside price action signals such as candlestick patterns and other technical indicators to inform trading decisions. Typical applications include entering long positions near support zones, trading breakouts above resistance zones, and detecting false breakouts by observing price wicks relative to the zones. The indicator supports customization to suit different trading styles, including scalping and swing trading, by adjusting the lookback period and zone height parameters.
Perfil do indicador
Avaliações de clientes
4.0
Avaliações: 2
5 | 0 % | |
4 | 100 % | |
3 | 0 % | |
2 | 0 % | |
1 | 0 % |
Conversa
Perguntas frequentes
Os produtos disponíveis através da cTrader Store, incluindo bots de negociação, indicadores e plugins, são fornecidos por programadores terceiros e são disponibilizados apenas para fins informativos e de acesso técnico. A cTrader Store não é um corretor e não fornece aconselhamento em matéria de investimento, recomendações pessoais ou qualquer garantia de desempenho no futuro.


![Logótipo de "Gaussian Channel [Iridio Capital]"](https://cdn.ctrader.com/image/webp/7c039209-5573-4a54-a072-f9528b503103_41960)


Preço
Desde 29/05/2025
3.04M
Volume negociado
45.22K
Pips ganhos
29
Vendas
769
Instalações gratuitas