Descrição
Este indicador de análise técnica fornece informações sobre o sentimento do mercado, tendência e níveis de preço. Ele utiliza dados como Volume, Open_Close, Chaikin Volatility e Chaikin Money Flow para calcular o sentimento do mercado. Também permite ajustar spreads, detectar tendências e visualizar níveis de preço e pips. É uma ferramenta útil para identificar a força predominante no mercado, antecipar movimentos de preço e melhorar a tomada de decisões de negociação.
Na descrição, indico os parâmetros importantes; o restante são configurações de estilo, como cor, tipo de linha e tamanho da fonte.
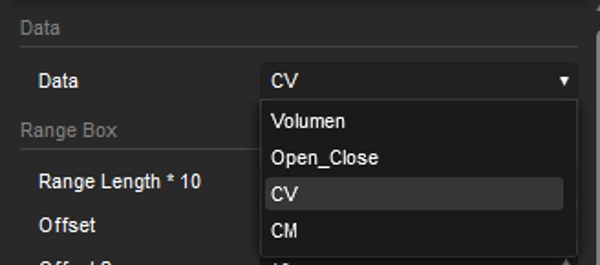
Dados
Os cálculos de sentimento são baseados na seleção entre Volume, Open_Close, Chaikin Volatility e Chaikin Money Flow.
Comprimento do Intervalo * 10
O valor indica o número de velas (períodos) nos quais o cálculo é baseado – o valor é multiplicado por 10.
Adicionar Zoom
Para manter o gráfico centralizado, isso também ajuda a considerar situações como consolidação e mudanças de tendência.
Margem
Permite ajustar as margens superior e inferior para melhorar a visualização.
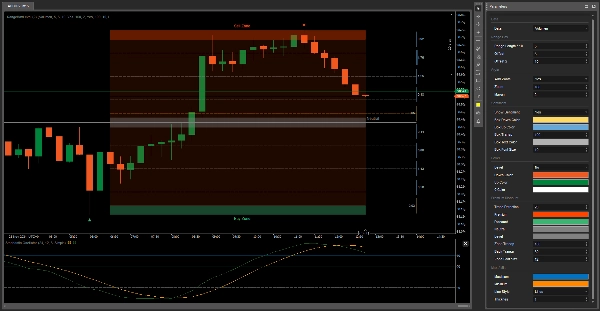
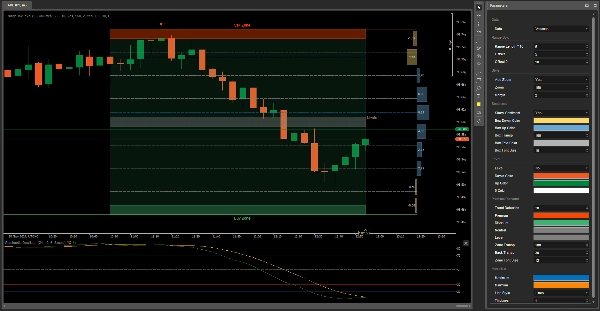
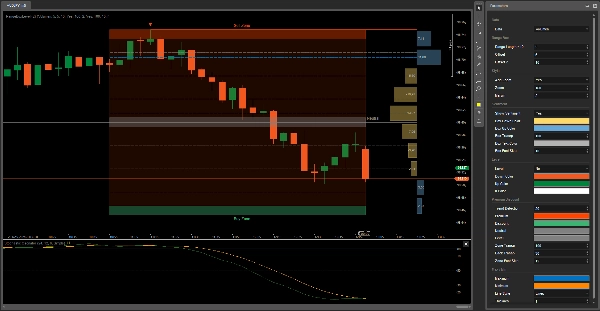
Mostrar Sentimento
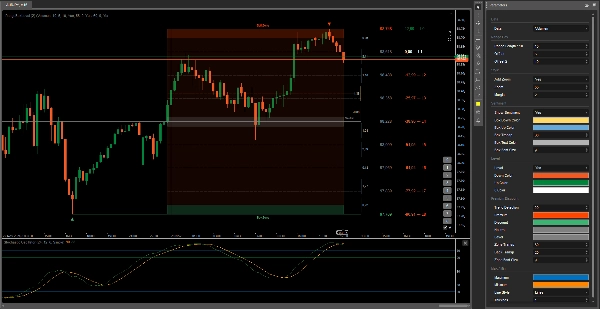
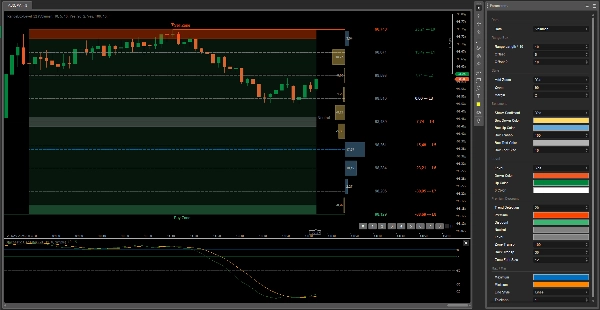
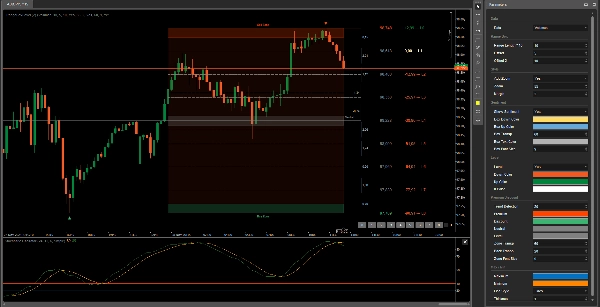
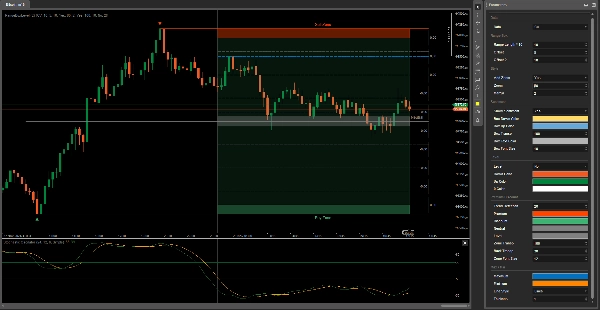
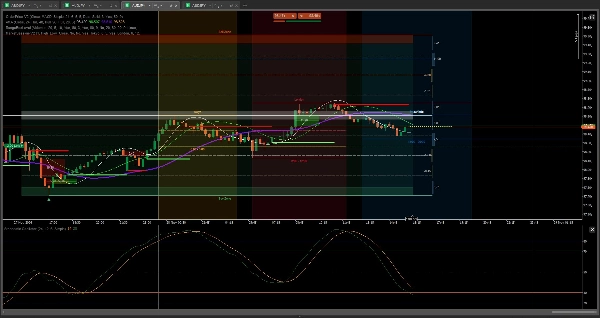
O sentimento indica qual força está mais forte no mercado no momento. Se as barras amarelas aumentam de tamanho, significa que há mais vendedores, e vice-versa. Se você não quiser ver a visualização do sentimento, pode ocultá-la no lado direito.
Nível
Esta é uma funcionalidade extra que pode ser usada como referência para preços e pips em cada nível. Quando você seleciona um nível onde deseja colocar a ordem de compra, indica os pips em cada nível que o preço pode alcançar.
Detecção de Tendência
Dependendo da tendência do ativo, o fundo da Caixa de Intervalo muda: verde se for alta e vermelho se for baixa.
Máx / Mín
Estas são as linhas azul e amarela que mudam sua posição de acordo com a previsão de onde o preço pode ir. A Caixa de Intervalo é dividida em 9 seções para ajudar a determinar os pontos de inflexão do preço, servindo como um Retração de Fibonacci.
Você será invencível
Boa sorte 😀
Resumo
Key features include sentiment visualization with bars indicating the dominance of buyers or sellers, trend detection through background color changes (green for bullish, red for bearish), and level indicators that display potential price and pip targets for placing orders. The Range Box is divided into nine sections to identify price inflection points, functioning similarly to Fibonacci retracement levels, with dynamic max/min lines predicting possible price movements.
This tool supports analysis across various markets including stocks, cryptocurrencies, indices like NAS100, and commodities such as XAUUSD (gold). It is suitable for trading strategies like scalping and grid trading and can assist traders in anticipating price movements and making informed decisions. The indicator integrates with additional tools for enhanced order price management and market session analysis.
Avaliações de clientes
5 | 100 % | |
4 | 0 % | |
3 | 0 % | |
2 | 0 % | |
1 | 0 % |