
Opis
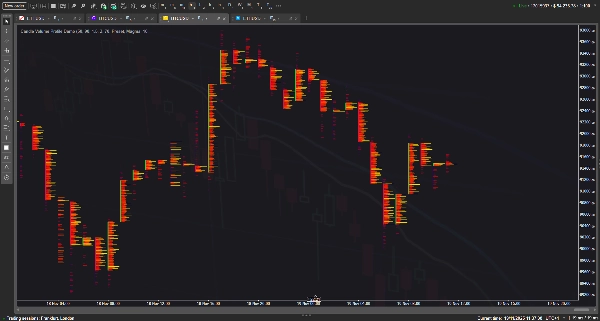
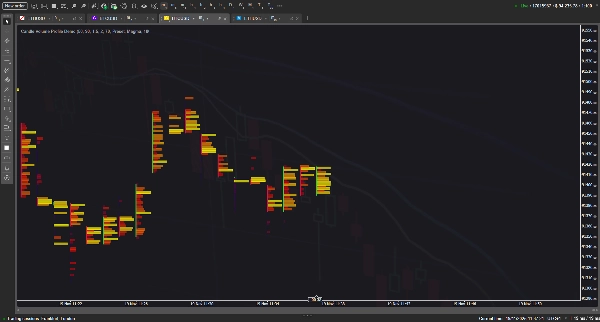
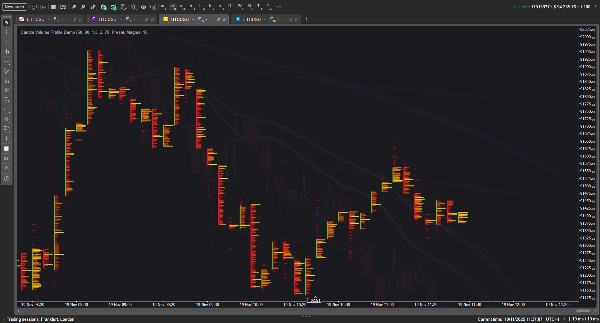
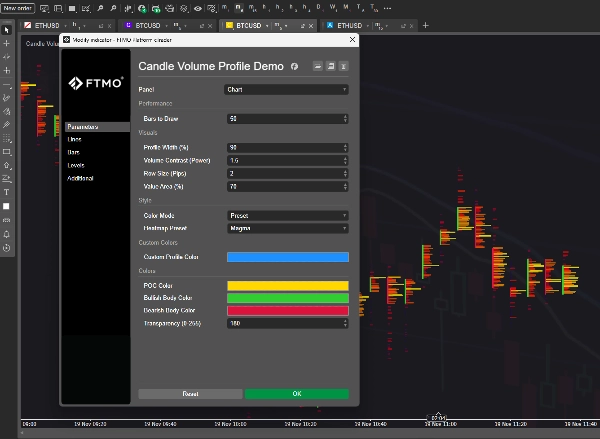
Ten wskaźnik wizualizuje Profil Wolumenu dla poszczególnych słupków, przekształcając standardowe świece w szczegółowy wykres w stylu 'odcisku stopy' z konfigurowalnymi mapami cieplnymi, liniami Punktu Kontroli (POC) oraz blokami Obszaru Wartości, aby podkreślić rozkład wolumenu na poziomie cenowym. Ma na celu naśladowanie profesjonalnych narzędzi do analizy przepływu zleceń poprzez wykorzystanie heurystycznego rozkładu wolumenu do bezpośredniego wyświetlania aktywności rynku na wykresie.
Teoretycznie ten koncept powinien działać bezproblemowo, dostarczając głębokich informacji o rynku; jednak w praktyce, ze względu na ogromną liczbę obiektów graficznych potrzebnych do renderowania, im więcej funkcji i głębokości historii wymagasz od tego wskaźnika, tym bardziej ma tendencję do opóźnień i powodowania niestabilności terminala. :(
Podsumowanie
Opinie klientów
5 | 0 % | |
4 | 100 % | |
3 | 0 % | |
2 | 0 % | |
1 | 0 % |


