
VolumeThermometer
Wskaźnik
426 pobrania
Wersja 1.0, Aug 2025
Windows, Mac
Od 26/05/2025
451.48M
Wolumen transakcji
61.16K
Zysk w pipsach
15
Sprzedaż
1.43K
Bezpłatne instalacje
Opis
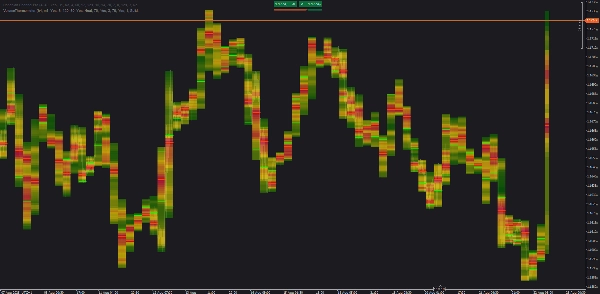
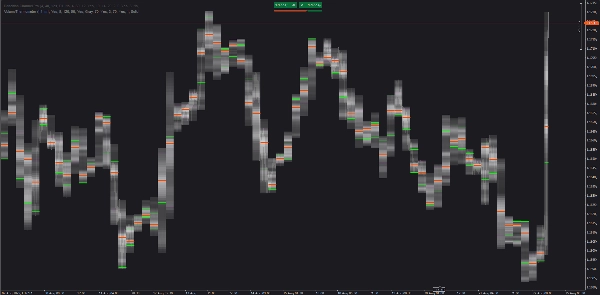
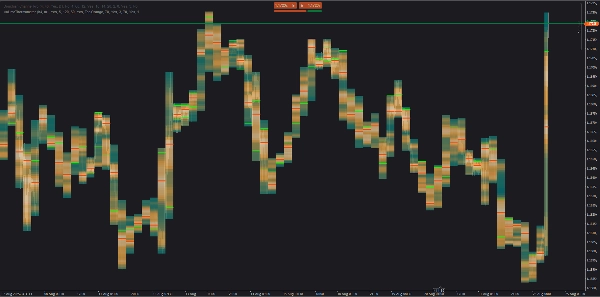
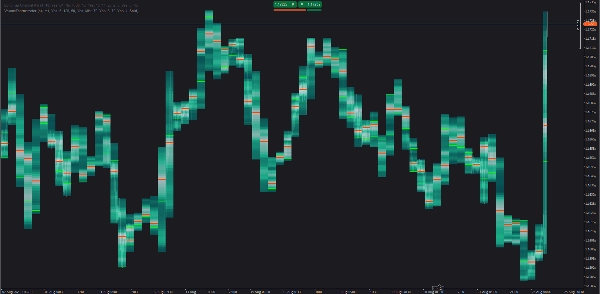
Mapa cieplna cTrader pokazująca, jak wolumen jest rozłożony w każdej świecy HTF. Wykorzystuje słupki LTF (np. M1) do budowy pionowych przedziałów wolumenu, następnie rysuje POC oraz Value Area (VA) linie. Aktualna (niedokończona) świeca HTF jest malowana w czasie rzeczywistym.
Jak to działa
- Agreguje wolumen tickowy ze słupków LTF.
- Dzieli każdą świecę HTF na
Binsfragmenty cenowe i przypisuje wolumen według nakładania się cen. - Koloruje przedziały według względnego wolumenu; rysuje POC, opcjonalne VA linie i może przedłużać je w prawo.
- Automatycznie ładuje starszą historię tylko dla widocznego zakresu (małe partie).
Jak używać
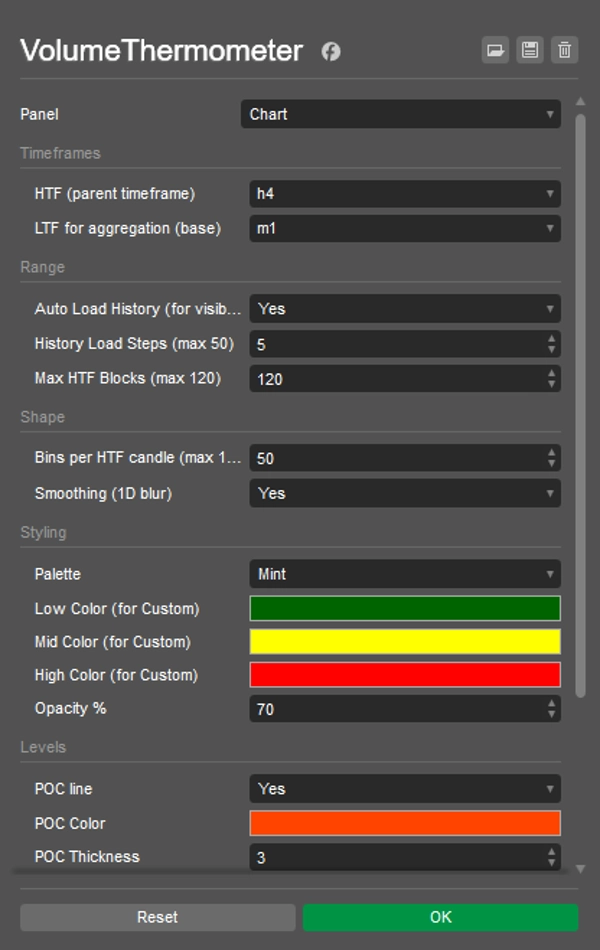
- Wybierz HTF (np. H4) oraz LTF (np. M1).
- Włącz Auto Load History; przewiń/powiększ zakres, który chcesz zobaczyć.
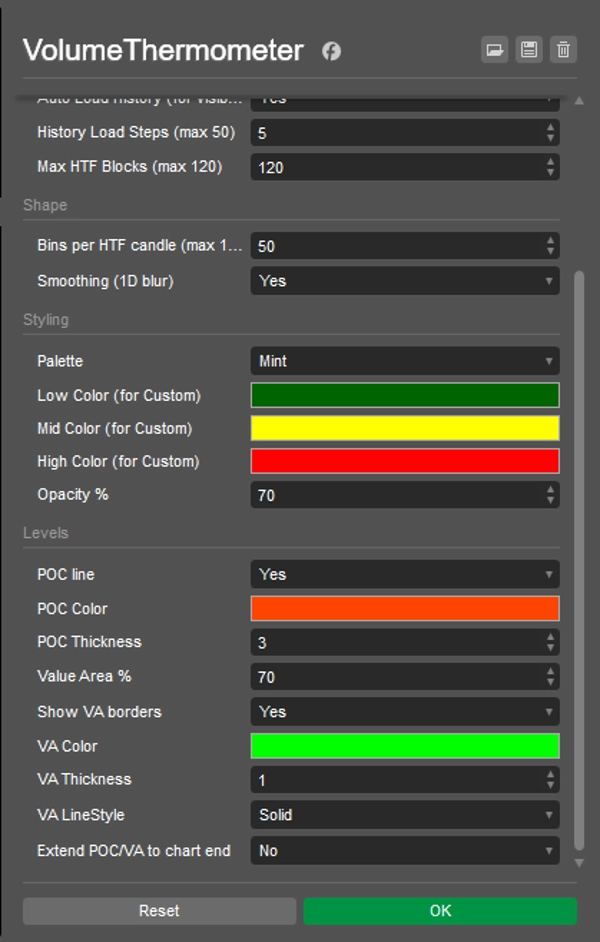
- Dostosuj Bins (szczegóły), Max HTF Blocks (ile świec pokazać), Smoothing, Opacity oraz kolory.
- Obserwuj reakcje POC/VA oraz jak POC przesuwa się ze świecy na świecę.
Szybkie pomysły
- Retest POC: pierwsze dotknięcie poprzedniego POC z potwierdzeniem LTF.
- Rotacja VA: ponowne wejście w VA często celuje w krawędź POC/innej VA.
- Przejście LVN: cienkie (zimne) obszary mają tendencję do szybkiego przejścia do następnego węzła.
Uwagi
- Używa wolumenu tickowego (dobry przybliżony wskaźnik na FX/CFD, nie wolumen giełdowy).
- Dla wydajności zmniejsz Bins lub Max HTF Blocks jeśli to konieczne.
Podsumowanie
Podsumowanie AI
VolumeThermometer is a cTrader indicator that visualizes intra-higher timeframe (HTF) volume distribution using a heatmap. It aggregates tick volume data from lower timeframe (LTF) bars (e.g., M1) to construct vertical volume bins within each HTF candle (e.g., H4). The indicator highlights the Point of Control (POC) and Value Area (VA) lines, showing where the most volume is concentrated by price level. The current HTF candle is updated in real time, and the indicator automatically loads historical data for the visible chart range in small batches to optimize performance.
Key features include:
- Aggregation of tick volume from LTF bars.
- Division of HTF candles into price bins with volume assigned by price overlap.
- Color-coded volume bins indicating relative volume intensity.
- Display of POC and optional VA lines, with the ability to extend these lines forward.
- Customizable settings for bin detail, maximum HTF candles displayed, smoothing, opacity, and colors.
- Supports multiple markets including Forex, indices, commodities, stocks, and cryptocurrencies such as BTCUSD and EURUSD.
Users can monitor POC retests, VA rotations, and low volume node pass-throughs to analyze volume behavior within HTF candles. The indicator uses tick volume as a proxy, suitable for FX and CFD markets.
Profil wskaźnika
Opinie klientów
0.0
Opinie: 0
Opinie klientów
Ten produkt nie ma jeszcze opinii. Wypróbowałeś(-aś) go już? Bądź pierwszy(-a) i powiedz o tym innym!
Dyskusja
Częste pytania
BTCUSD
Prop
Forex
Indices
EURUSD
Commodities
Crypto
Stocks
NAS100
Produkty dostępne za pośrednictwem cTrader Store, w tym boty handlowe, wskaźniki i wtyczki, dostarczane są przez deweloperów zewnętrznych i udostępniane wyłącznie w celach informacyjnych oraz w celu zapewnienia dostępu technicznego. cTrader Store nie jest brokerem i nie zapewnia doradztwa inwestycyjnego, nie udziela spersonalizowanych rekomendacji ani nie gwarantuje przyszłych wyników.


Cena
Od 26/05/2025
451.48M
Wolumen transakcji
61.16K
Zysk w pipsach
15
Sprzedaż
1.43K
Bezpłatne instalacje