
Market Entropy
Wskaźnik
107 pobrania
Wersja 1.0, Aug 2025
Windows, Mac
Od 26/05/2025
388.58M
Wolumen transakcji
60.75K
Zysk w pipsach
15
Sprzedaż
1.41K
Bezpłatne instalacje
Opis
Market Entropy to podwójny wskaźnik (oscylator + opcjonalna nakładka cenowa), który kwantyfikuje organizację rynku i sygnalizuje zmiany reżimu w całym Porządek → Przejście → Chaos. Dodaje drugą linię, Trendness (DC), aby oddzielić prawdziwy trend od ścisku zmienności.
Jak to działa:
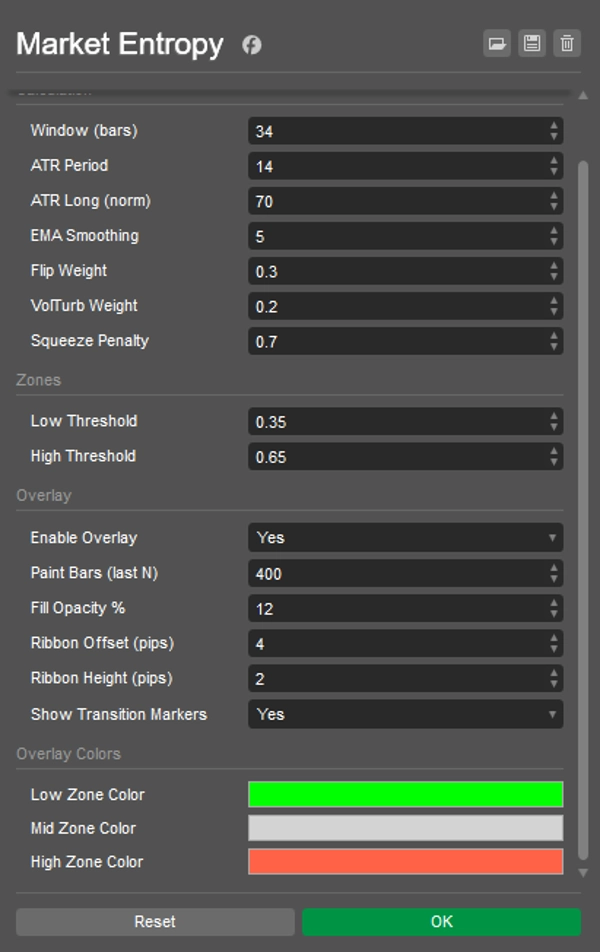
- Używa tylko składników OHLCV: DC (konsystencja kierunku), FlipRate (zmiany znaku), Volatility_n (ATR/ATRlong), VolumeTurb (odchylenie standardowe ΔVolume).
- Surowa entropia:
E0 = 0.5*(1-DC) + 0.3*(FlipRate*VolN) + 0.2*VolumeTurb). - Termin anty-ścisku obniża E podczas kompresji ATR → ostateczna Entropia ∈ [0..1] z wygładzaniem EMA.
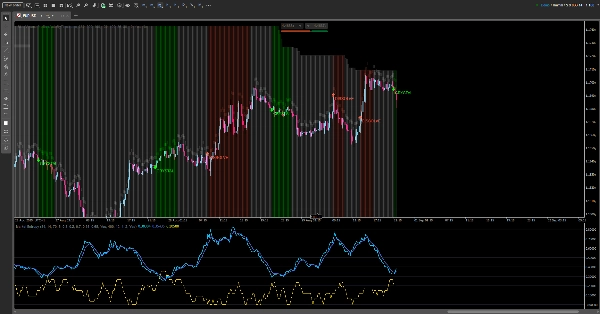
- Markery:
-
- CRYSTAL — przecięcie poniżej LowThr (pojawia się porządek: trend lub ściśnięcie przed wybiciem).
- DISSOLVE — przecięcie powyżej HighThr (porządek się łamie: rozpad chaosu/trendu).
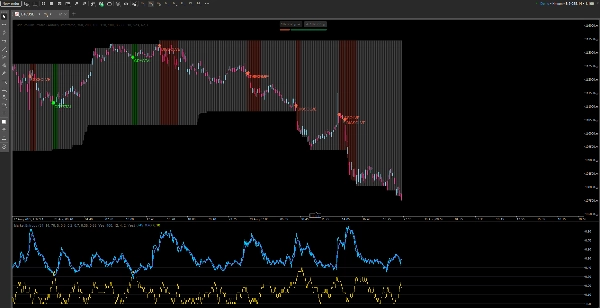
Co widzisz:
- W panelu: Entropy, Entropy(EMA), Trendness (DC), progi Low/High, tło strefy.
- Na wykresie (możliwe do włączenia): słupki kolorowane stanem, cienka wstążka nad maksimami oraz markery CRYSTAL/DISSOLVE.
Przewodnik czytania:
- E < LowThr → Porządek:
-
- z wysokim DC → zorganizowany trend;
- z niskim ATR → ściśnięcie (oczekuj wybicia).
- LowThr…HighThr → Przejście: formowanie struktury; czekaj na rozstrzygnięcie.
- E > HighThr → Chaos: niepewność / wyczerpanie trendu; unikaj naiwnych wejść kontynuacyjnych.
Strategie:
- Ściśnięcie → CRYSTAL → Wybicie/Retest — handluj wybicie.
- Trend → DISSOLVE — zmniejsz pozycję lub zaostrz ryzyko.
Podsumowanie
Profil wskaźnika
Opinie klientów
0.0
Opinie: 0
Opinie klientów
Ten produkt nie ma jeszcze opinii. Wypróbowałeś(-aś) go już? Bądź pierwszy(-a) i powiedz o tym innym!
Dyskusja
Częste pytania
Produkty dostępne za pośrednictwem cTrader Store, w tym boty handlowe, wskaźniki i wtyczki, dostarczane są przez deweloperów zewnętrznych i udostępniane wyłącznie w celach informacyjnych oraz w celu zapewnienia dostępu technicznego. cTrader Store nie jest brokerem i nie zapewnia doradztwa inwestycyjnego, nie udziela spersonalizowanych rekomendacji ani nie gwarantuje przyszłych wyników.


![Logo „Gaussian Channel [Iridio Capital]”](https://cdn.ctrader.com/image/webp/7c039209-5573-4a54-a072-f9528b503103_41960)

![Logo „[Stellar Strategies] Inside Bar with Signals”](https://cdn.ctrader.com/image/webp/1d9e8bfa-3b2c-4440-bb37-5856902008a7_30683)


![Logo „Trend Angle Indicator [Iridio Capital]”](https://cdn.ctrader.com/image/webp/28a98496-3412-4fea-82eb-be3347bdd6f1_27612)


Cena
Od 26/05/2025
388.58M
Wolumen transakcji
60.75K
Zysk w pipsach
15
Sprzedaż
1.41K
Bezpłatne instalacje