
Opis
Opis
Wskaźniki Pinescriptlabs Store: 🤖Pinescriptlabs Store cBoty :
ICT Power of 3 (cBot) Gold & BTC BreakoutSession Pivots(nowy)YieldShield"
SmartTrend Support &
Resistance Lines
Dynamic Market Structure
Analiza punktów zwrotnych
Fibonacci Linear
Regresja wielookresowa
Multi-Level Candle Bias
Tracker
Auto Support and
Resistance Trend Lines
All Support and
Resistance Levels
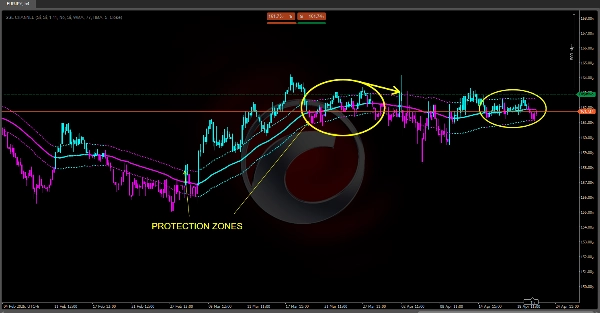
Premiumowy kanał SSL 🔍
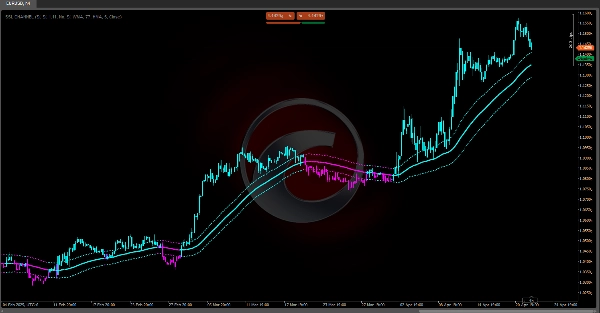
Łączy wykrywanie trendu za pomocą średniej kroczącej, ocenę zmienności z wykorzystaniem pasm opartych na ATR oraz filtr krótkoterminowy (SSL) w celu dostarczenia zintegrowanego systemu analizy. 💡 Jego siła polega na czytelności sygnałów wizualnych i adaptacyjności na różnych rynkach, podczas gdy jego główne wyzwanie to minimalizacja opóźnień i filtrowanie ruchów bocznych. Przy odpowiedniej parametryzacji staje się potężnym narzędziem do podejmowania decyzji wejścia/wyjścia w handlu. 🎯
1. Cel i użyteczność handlowa 📊
• Główne wykrywanie trendu: Dzięki linii centralnej (tzw. "Baseline") wskaźnik pokazuje dominujący kierunek rynku. 📈📉
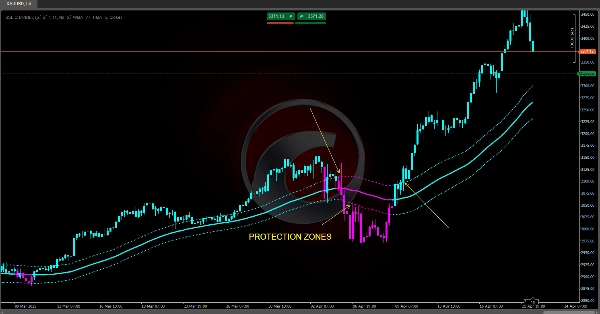
• Pomiar zmienności: Wykorzystując średni zakres (ATR), dostosowuje dwa pasma (powyżej/poniżej Baseline) jako dynamiczne strefy wsparcia/oporu. ⚡
• Filtr szumu i zmiana biasu: Kanał SSL (adaptacyjna średnia krocząca oparta na maksimach/minimach) identyfikuje krótkoterminowe odwrócenia dla precyzyjnych wejść/wyjść. 🔄
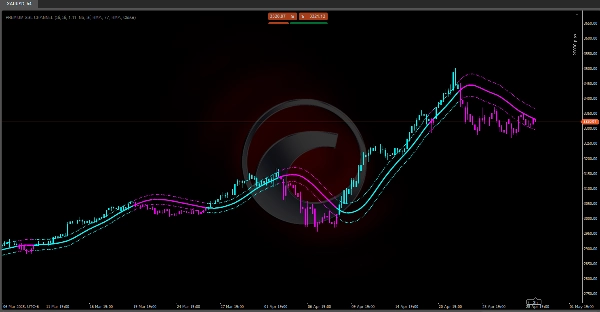
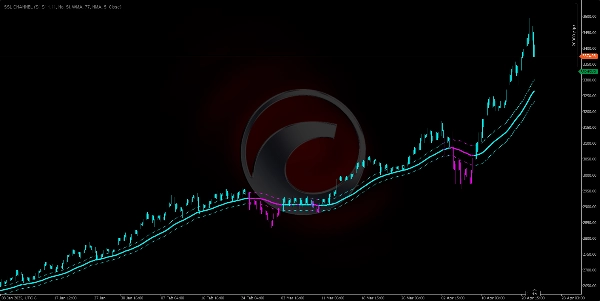
• Intuicyjna wizualizacja: Koloruje słupki cenowe i linie według biasu (cyjan = byczy, magenta = niedźwiedzi) dla natychmiastowej interpretacji. 🎨
2. Główne komponenty i logika ⚙️
2.1. Linia centralna ("Baseline")
• Oblicza średnią kroczącą ceny (SMA, EMA, WMA lub Hull) w celu wygładzenia szumu.
• Reprezentuje średnią wartość rynku, pokazując dominujący trend:
- Cena powyżej → Trend byczy. 🟢
- Cena poniżej → Trend niedźwiedzi. 🔴
2.2. Średni zakres (ATR)
• Mierzy rzeczywistą zmienność rynku, uśredniając wcześniejsze maksima/minima/zamknięcia.
• Wyższy ATR = Większa zmienność; Niższy ATR = Spokojniejsze rynki. 🌊
2.3. Dynamiczne pasma ("Up ATR" & "Down ATR")
• Up ATR = Baseline + (ATR × Mnożnik)
• Down ATR = Baseline – (ATR × Mnożnik)
• Działa jako kanały cenowe:
- Cena dotyka górnego pasma → Siła byków. 🚀
- Cena blisko dolnego pasma → Momentum niedźwiedzi. 🐻
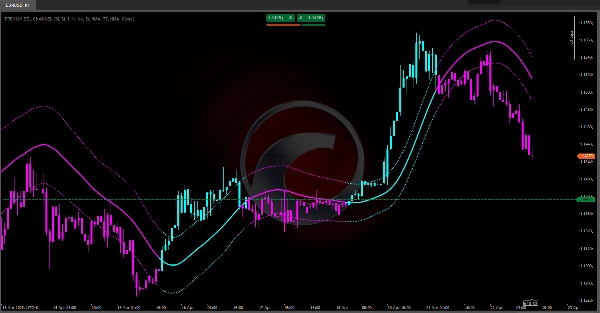
2.4. Kanał SSL (Signal-Smooth-Line)
• Używa średnich kroczących na maksimach/minimach osobno.
• Logika kierunku:
- Zamknięcie powyżej wysokiej MA → Byczy bias. ✅
- Zamknięcie poniżej niskiej MA → Niedźwiedzi bias. ❌
- Pomiędzy → Poprzedni bias utrzymany.
• Działa jako filtr trendu krótkoterminowego, potwierdzając/przecząc Baseline. 🔄
3. Generowanie sygnałów i praktyczne zastosowanie 🛠️
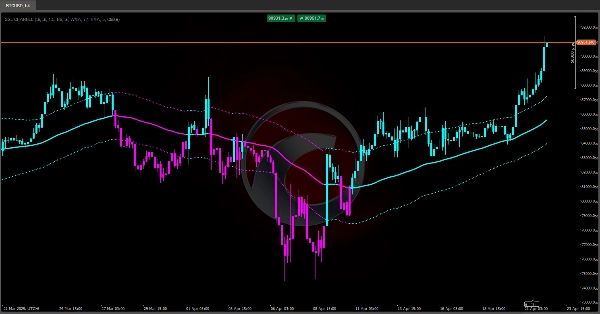
1. Potwierdzenie trendu
- Silny byczy: Cena > Up ATR. 🟢
- Umiarkowany byczy: Up ATR > Cena > Baseline.
- Umiarkowany niedźwiedzi: Baseline > Cena > Down ATR.
- Silny niedźwiedzi: Cena < Down ATR. 🔴
2. Filtr SSL
- Wejścia: Wchodź na długą pozycję tylko jeśli SSL jest powyżej swojej linii (lub krótko jeśli poniżej). ⬆⬇
- Wyjścia: Częściowe/pełne wyjście, gdy SSL odwraca się i przecina przeciwną wysoką/niską MA. ✋
3. Kolorowanie słupków
- Słupki cenowe zmieniają kolor na cyjan (byczy) lub magenta (niedźwiedzi), zsynchronizowane z Baseline dla szybkiego odczytu rynku. 🎨
4. Konfigurowalne parametry i ich wpływ ⚖️
• Okres Baseline: Dłuższy = gładszy, ale z opóźnieniem; krótszy = bardziej responsywny, ale z większym szumem. 🐢⚡
• Mnożnik pasma: Wyższy = szerszy kanał (mniej fałszywych sygnałów); niższy = węższy (więcej sygnałów, więcej fałszywych ruchów). ↔️
• Typ MA (SMA/EMA/WMA/HMA): Wpływa na ważenie cen ostatnich vs. historycznych. 📅
• Okres i typ SSL: Definiuje czułość filtra krótkoterminowego. 🎚️
Podsumowanie
Opinie klientów
5 | 100 % | |
4 | 0 % | |
3 | 0 % | |
2 | 0 % | |
1 | 0 % |


