Opis
▁▂▃▄▅▆▇ █ 10 000+ traderów (instytucjonalni + detaliczni) █ ▇▆▅▄▃▂▁
- Wybierz nasze NAJLEPSZE wskaźniki w cTrader 🏆
- ✨ Ekskluzywna precyzja dla lepszych wyników ✨
- 📈 Nasze algorytmy — z najwyżej ocenianą wizualizacją 🎯—
- zostały pomyślnie wdrożone w 2 funduszach kwantowych
▁▂▃▄▅▆▇ █████████████████████████████ ▇▆▅▄▃▂▁
_______________________________________________
_______________________________________________
📌 Wskaźniki Struktury Rynku
· ✅ AdvancedMarket Structure: Bos, Choch, SwinLevels, Order Blocks, Market Structure& Liquidity Finder
· 🔄 Dynamic Market StructureAnalysis of Turning Points
· 🧱 Order Block
· ⚖️ Market Imbalance
· ⛓️ BOS & CHOCH
· 🧠 ICT Power of 3
______________________________________________________________-
Sklep cBots : 🧠 Gold & BTC BreakoutSession Pivots 🧠
_______________________________________________
🔚 Inteligentne Systemy Wyjścia
_______________________________________________
📐 Wskaźniki ZigZag
· 🔍 ZigZag Price LiquidityProjection
· ➖ ZigZag
_______________________________________________
🧱 Wskaźniki Wsparcia i Oporu
· 🟩 SmartTrend Support &Resistance Lines
· 🧱 All Support and ResistanceLevels
_______________________________________________
📊 Wskaźniki Trendu i Kanału
· 📊 Supertrend
_______________________________________________
💧 Narzędzia Wolumenu i Płynności
_______________________________________________
⚡ Wskaźniki Momentum i RSI
· 🔎 Multi-Level Candle BiasTracker
_______________________________________________
🔮 Narzędzia Prognozowania i Projekcji
· 📐 Prognoza oparta na Linreg& ATR
· 📏 Fibonacci Linear RegressionMulti-timeframe
· 📈 Projektor Przepływu Rynku Napędzany Wolumenem
______________________________________________________________________________________________________
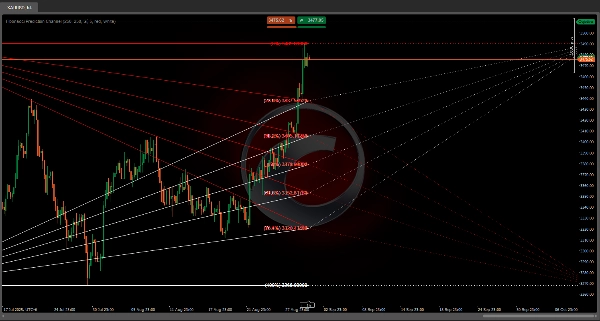
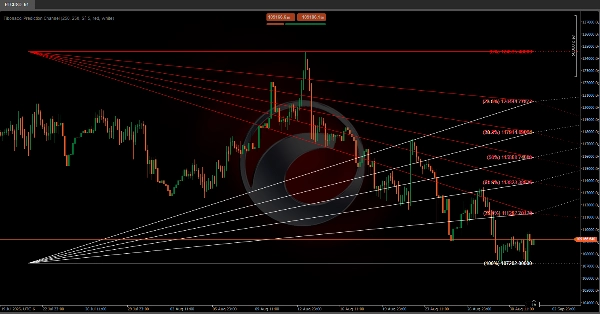
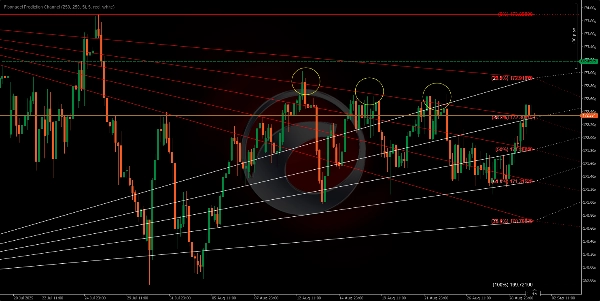
Ten algorytm został zaprojektowany do rysowania przyszłego kanału prognozy opartego na poziomach zniesienia Fibonacciego 📊✨. Linie Fibonacciego tworzą serię równoległych kanałów pomiędzy każdą parą kolejnych poziomów. Kanały te można interpretować jako zakresy, w których oczekuje się wahań ceny 📈📉, generując wizualny stożek, z którym cena będzie wchodzić w interakcję 🎯. Jeśli poziom zostanie przełamany ⚡, przechodzimy do następnego.
Te poziomy, które projektujemy w przyszłość, działają również jako wsparcie i opór 🛡️⚔️, tworząc wizualne kanały na wykresie, które mogą pomóc nam przewidywać i planować działania 🧠✅ w oparciu o to, jak cena reagowała na te poziomy w przeszłości.
Możemy oczekiwać, że cena zareaguje zbliżając się do tych linii 🔍, potencjalnie odbiciem w obrębie kanału 🔄 lub, jeśli będzie wystarczająco dużo impetu 🚀, przebiciem linii i przejściem do następnego kanału.
Poziomy projektowane w prawo ➡️🗓️ nie opierają się na nowych danych cenowych, lecz na przeszłej akcji cenowej ⏳. Rozciągają się w przyszłość jako rodzaj "mapy" 🗺️ potencjalnych przyszłych reakcji cen.
Historyczne Świece ⏰: Określa, ile przeszłych okresów cenowych będzie branych pod uwagę przy obliczaniu poziomów zniesienia Fibonacciego.