
Opis
📌 Opis dla sklepu cTrader – Francuski 🇫🇷
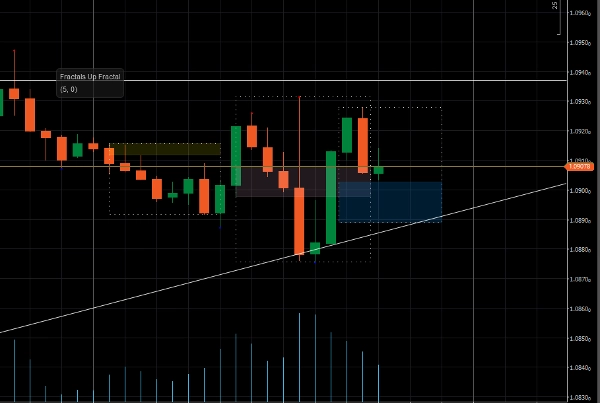
🔍 Wskaźnik [LDE] OPR & Market Sessions – Jasna wizualizacja sesji!
Ten wskaźnik podkreśla główne sesje rynkowe (Tokio, Londyn, Nowy Jork) wyświetlając dynamiczne prostokąty na Twoim wykresie.
✔ Dostosowywalny wyświetlacz sesji 🏙️
✔ Wizualizacja poziomów High/Low dla każdej sesji 📈
✔ Podkreślenie zakresu ceny otwarcia (OPR) ⏳
✔ Regulowana przezroczystość dla lepszej czytelności 🎨
✔ Kompatybilny ze wszystkimi aktywami i ramami czasowymi ⏰
🔧 Elastyczne ustawienia: włącz/wyłącz każdą sesję, dostosuj kolory i spersonalizuj wyświetlanie H/L dla każdej sesji.
🚀 Optymalizuj swój trading, identyfikując kluczowe strefy rynku na pierwszy rzut oka!
📌 Description for cTrader Store – English 🇬🇧
🔍 [LDE] OPR & Market Sessions Indicator – Clear visualization of sessions!
This indicator highlights major market sessions (Tokyo, London, New York) by displaying dynamic rectangles on your chart.
✔ Customizable session display 🏙️
✔ Session-specific High/Low visualization 📈
✔ Highlighting of the Open Price Range (OPR) ⏳
✔ Adjustable transparency for better readability 🎨
✔ Compatible with all assets and timeframes ⏰
🔧 Flexible settings: enable/disable each session, adjust colors, and personalize the High/Low display for each session.
🚀 Optimize your trading by identifying key market zones at a glance!
Podsumowanie
Opinie klientów
5 | 0 % | |
4 | 100 % | |
3 | 0 % | |
2 | 0 % | |
1 | 0 % |


