Penerangan
Penunjuk Kedai Pinescriptlabs: 🤖Pinescriptlabs Kedai cBots:
SmartTrend Sokongan &
Garis Rintangan Emas & BTC BreakoutSesi Pivots(baru)YieldShield" 🛡️
Struktur Pasaran Dinamik
Analisis Titik Perubahan
Fibonacci Linear
Regresi Pelbagai Jangka Masa
Bias Lilin Pelbagai Tahap
Penjejak
Sokongan Auto dan
Garis Trend Rintangan
Semua Tahap Sokongan dan
Rintangan
Penunjuk ShieldedTrend berdasarkan gabungan pintar dua metodologi perdagangan yang digunakan secara meluas: lilin Heikin-Ashi 📊 dan purata bergerak eksponen (EMA) 📈. Berikut adalah logik langkah demi langkah:
1️⃣ Asas: Lilin Heikin-Ashi yang Diubahsuai
Lilin Heikin-Ashi adalah versi yang dilicinkan daripada lilin tradisional, direka untuk menapis bunyi pasaran. Pengiraannya yang asal menggunakan purata harga, tetapi ShieldedTrend mengubahnya dalam dua cara utama:
- Penutupan Heikin-Ashi:
Dihitung sebagai purata 4 harga utama lilin sebenar:
(Buka + Tinggi + Rendah + Tutup) / 4 🔄. - Pembukaan Heikin-Ashi:
Tidak diambil terus dari harga sebenar, tetapi purata pembukaan dan penutupan lilin Heikin-Ashi sebelumnya.
Ini menghasilkan kesan "pelinciran" semula jadi yang menghapuskan turun naik tajam, menjadikan trend lebih jelas.
2️⃣ Pelinciran dengan EMA
ShieldedTrend menggunakan purata bergerak eksponen (EMA) kepada kedua-dua komponen lilin Heikin-Ashi:
- Garis Pembukaan Licin:
EMA yang digunakan pada pembukaan Heikin-Ashi. - Garis Penutupan Licin:
EMA yang digunakan pada penutupan Heikin-Ashi.
EMA memberikan lebih berat kepada data terkini, membolehkan penunjuk bertindak balas dengan cepat terhadap perubahan trend sementara mengekalkan kelicinan.
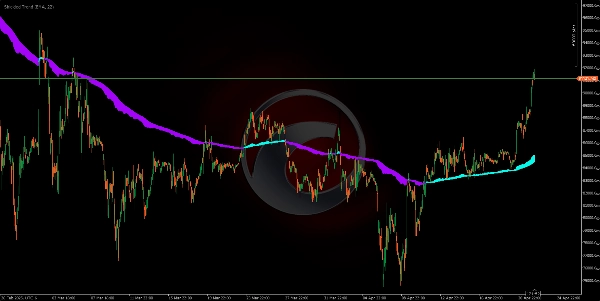
3️⃣ "Zon Perlindungan" (Perisai) 🛡️
Kawasan berwarna antara dua garis (pembukaan dan penutupan licin) bertindak sebagai zon penampan atau pengesahan:
- Lebar Zon:
Bergantung pada perbezaan antara dua garis tersebut. -
- Kawasan luas = Trend kuat (garis jauh antara satu sama lain) 💪.
- Kawasan sempit = Ketidakpastian atau trend lemah 🤔.
4️⃣ Logik Perdagangan Terpadu
- Isyarat Trend:
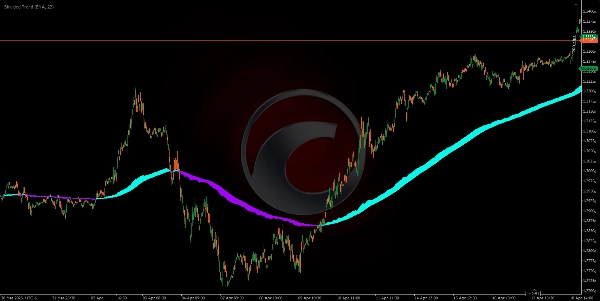
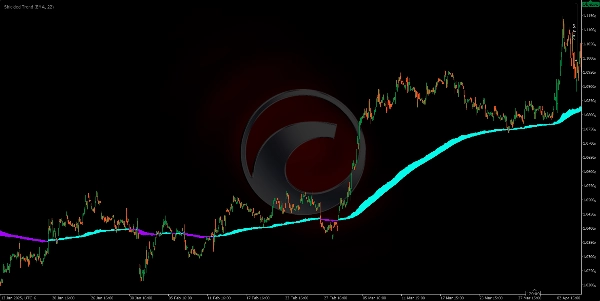
Perubahan warna menunjukkan kemungkinan pembalikan (contoh, cyan ke ungu = kemungkinan permulaan trend menurun) 🔵🟣. - Kekuatan Trend:
Lebar kawasan berwarna bertindak sebagai penapis keyakinan: -
- Hanya berdagang jika kawasan cukup luas (mengelakkan pasaran yang tidak menentu) ✅.
- Perlindungan Terhadap Pergerakan Palsu:
Jika kawasan tiba-tiba menjadi sempit, ia menunjukkan trend semasa mungkin kehilangan momentum—walaupun warna belum berubah lagi ⚠.
🌟 Kenapa Ia Berfungsi?
- Heikin-Ashi + EMA: Melicinkan harga dua kali (lilin + purata bergerak), menapis 90% bunyi 🎯.
- Zon Perlindungan: Mengelakkan perdagangan dalam pasaran yang tidak jelas, mengurangkan perdagangan gagal 📉➡️📈.
- Pendekatan Visual: Gabungan warna dan kawasan memudahkan pedagang pemula untuk mengenal pasti corak dengan cepat ⚡.
Ringkasan
The indicator applies EMA smoothing to both the Heikin-Ashi open and close lines, enabling quick reaction to trend changes while maintaining smoothness. The area between these two smoothed lines forms a "Protection Zone" or shield, which acts as a buffer and confirmation zone. The width of this zone indicates trend strength: a wide zone signals a strong trend, while a narrow zone suggests indecision or a weak trend.
ShieldedTrend’s integrated trading logic uses color changes to signal potential trend reversals and the zone width as a confidence filter to avoid trading in choppy markets. The indicator helps protect against false moves by signaling when trend momentum is weakening even before a color change occurs. Its visual design facilitates quick pattern recognition, making it accessible for traders of all experience levels.