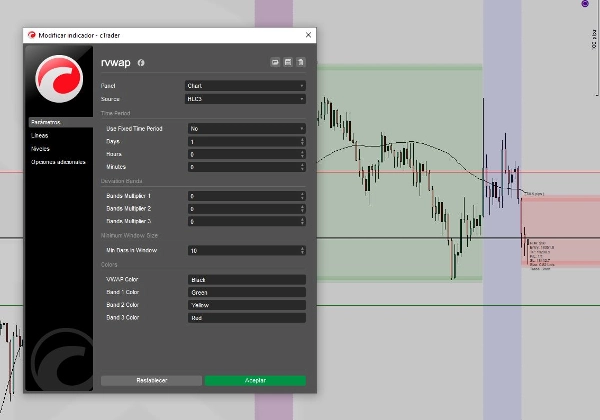
Brokerzy i firmy proptradingowe
Dla firm
00
Days
:
00
Hours
:
00
Minutes
:
00
Seconds
Wskaźnik
NAS100
NZDUSD
XAUUSD
Commodities
Forex
EURUSD
GBPUSD
BTCUSD
VWAP
Indices
Prop
Stocks
Crypto
USDJPY
Scalping
rvwap v1
31/10/2025
2
Desktop
Od 13/01/2025
Sprzedaż
2
Przesłany obraz „rvwap v1”

This Rolling VWAP (Volume Weighted Average Price) indicator for cTrader allows traders to visualize VWAP over a dynamic or fixed time period. You can customize the time window using days, hours, and minutes, or let the indicator automatically adjust based on the current chart timeframe. The source price can be selected from options like Close, Open, High, Low, HL2, HLC3, and OHLC4. It includes up to three standard deviation bands above and below the VWAP for identifying potential support and resistance zones. You can also set a minimum number of bars to ensure a reliable calculation even when the time window is short. Ideal for intraday and swing traders seeking dynamic VWAP-based signals and zones of confluence. Includes full color customization for each line. Built for precision, performance, and maximum flexibility.

0.0
Opinie: 0
Opinie klientów
Ten produkt nie ma jeszcze opinii. Wypróbowałeś(-aś) go już? Bądź pierwszy(-a) i powiedz o tym innym!
Więcej od tego autora
Pips V4Final
Displays pips from daily open with high/low. Clean, customizable, perfect for quick daily price context.
Wskaźnik
ATR
Forex
RISK V1
Automated position sizing based on risk, entry, and stop loss with ATR support and visual trade setup on charts.
Możesz także polubić
Wskaźnik
Breakout
Fibonacci
Initial Balance
Track Initial Balance ranges across any period with optional Fibonacci levels and projections.
Wskaźnik
Breakout
Forex
On Balance Volume
On Balance Volume (OBV) measures buying and selling pressure as a cumulative indicator.
Wskaźnik
RSI
Breakout
XAUUSD
+5
Channel Price Predictor
🔮Channel Price Predictor: Anticipates future price zones with trend channels based on volatility and projections." 📈
DMI MONDAY ZONES v2.1
Marks Monday's OPEN,HIGH & LOW. These are areas of support and resistance for the week.
Wskaźnik
NAS100
NZDUSD
XAUUSD
+14
Donchian Channel Pro
Tracks N-period highs/lows, HTF overlay, HUDs with ADX, RSI, session clocks. Customizable for precise trading.
Wskaźnik
Grid
NAS100
RSI
+17
Sessions with OR
Session boxes with UTC offset, OR logic, adjustable opacity, and multi-day lookback.
Wskaźnik
Grid
NAS100
NZDUSD
+16
Frac Support Resistance V1
Smart Support/Resistance lines auto calculated from D1/H4/H1/M15. Highly customizable visuals + built in Backtest Mode.
Najwyżej oceniane
Za darmo
Wskaźnik
RSI
Breakout
Supertrend
Swing Levels
🔍 Automatically detect support and resistance levels based on "swings" or pivots
Candle Timer & Strength Panel Demo -
Candle Timer & Strength Panel DEMO for cTrader DEMO VERSION – 24 hours free trial! This is a DEMO version of the Candle
Wskaźnik
RSI
Indices
Stocks
+3
FiboTrend-Pro V2
New version of one of my favorites includes Fibonacci and moving average convergence divergence lines
Wskaźnik
Indices
ATR
Stocks
+4
UT Bot Alert
A powerful ATR-based indicator generating clear BUY/SELL signals. Features real-time alerts and customizable sensitivity
Order Block Finder
Order Block Detector is built to spot and display Order Blocks on chart, often triggering strong price reactions.
Wskaźnik
Indices
RSI
Signal
[Stellar Strategies] MARSI Signal Plotter
🚀📈 Plot buy/sell signals on Range Bars using Moving Averages and RSI. Clear, actionable trading insights.🚀📈
Wskaźnik
XAUUSD
Commodities
Forex
+10
Perfect Entry Price
Perfect Entry Price designed to help traders identify the most accurate and reliable price levels for market entries
Wskaźnik
Indices
E7 BlackScholes Model
Option pricing using the BlackScholes model and the Math.Numerics packages
Wskaźnik
NAS100
NZDUSD
XAUUSD
+14
Swing LowHigh
Auto-detects Swing Highs/Lows to draw dynamic Support & Resistance levels with break tracking.
Wskaźnik
NAS100
NZDUSD
XAUUSD
+12
Coral Filter Lite
🐠 Free trend baseline - without the noise. Free limited version of Coral Filter X Pro 🐠
Wskaźnik
Indices
RSI
Stocks
+5
REDGREENZONEREVERSAL
The Red & Green Zone Reversal Indicator detects overbought and oversold market conditions using Bollinger Bands and RSI.