
説明
主な目的:
価格レベルごとの出来高分布をマッピングして特定する:
高流動性エリア
低流動性エリア
買い手と売り手の不均衡
このインジケーターは市場構造を理解し、取引の高確率エリアを特定するのに強力です! 🎯
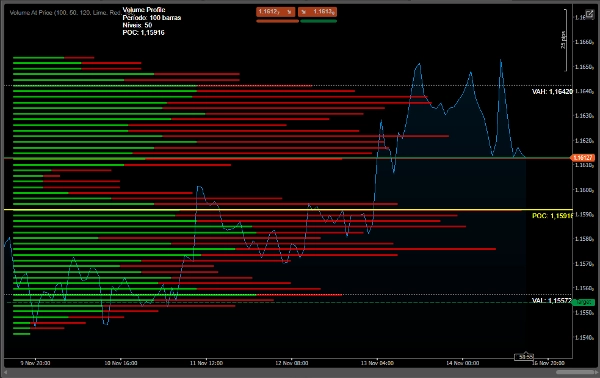
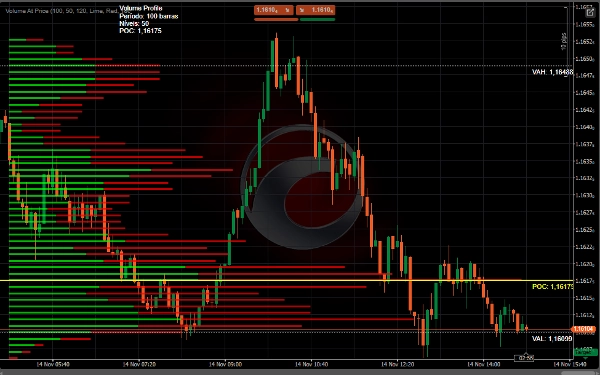
1. POC(ポイント・オブ・コントロール)
Linha Amarela - 最も取引量の多い価格
最大の流動性と価格のエリア
自然なサポート/レジスタンス
2. バリューエリア
白線 - 出来高の70%が取引されたエリア
VAH(バリューエリアハイ) - 上限
VAL(バリューエリアロー) - 下限
市場のバランスゾーン
3. 出来高のコア
🟢 緑 - 優勢な買い出来高
🔴 赤 - 優勢な売り出来高
バーの長さ = 出来高の強度
📊 戦略の使用
1. サポートとレジスタンスの識別
• POCは動的なサポート/レジスタンスとして機能する
• バリューエリアはバランスゾーンを定義する
• 重要なS/Rプロファイルの端
2. ブレイクアウト分析
• VAHを上抜け → 強いトレンド
• VALを下抜け → ダウントレンド
• ブレイクしない出来高が動きを確認する
3. エントリーポイント
• 購入:買い手の出来高でVALを再テスト
• 売却:売り手の出来高でVAHを再テスト
• フェード:プロファイルの極端な部分に逆らって取引
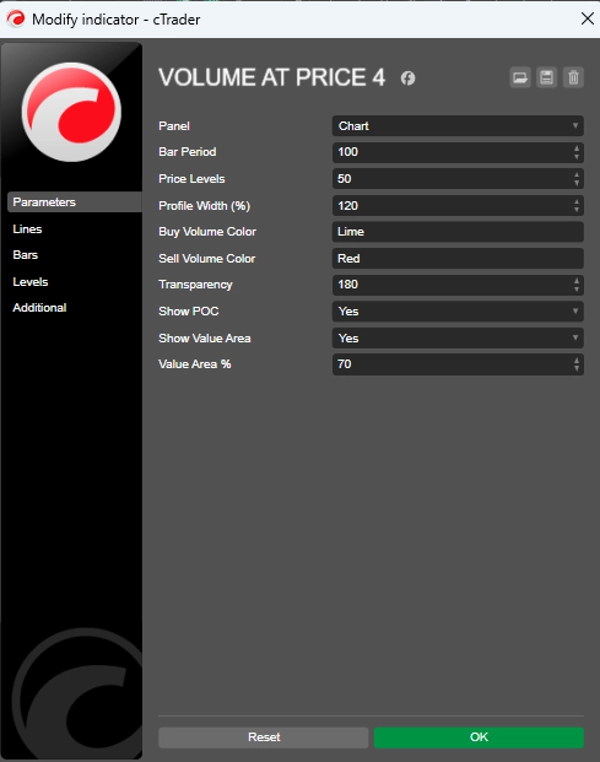
⚙️ 推奨設定
デイトレード用
csharp
期間 = 50-100
価格レベル = 50
プロファイル幅 = 120%
バリューエリア% = 70
スイングトレード用
csharp
期間 = 100-200
価格レベル = 80
プロファイル幅 = 150%
バリューエリア% = 70
✅ 利点:
動的なサポート/レジスタンスを特定する
市場の意図(出来高)を示す
重要な流動性エリアを明らかにする
不均衡の明確な可視化
Contagem 現在の出来高ティック
概要
- Point of Control (POC): The price level with the highest traded volume, acting as a dynamic support or resistance.
- Value Area: The price range where 70% of volume is traded, defined by Value Area High (VAH) and Value Area Low (VAL), representing market balance zones.
- Volume Cores: Colored bars indicating dominant buying (green) or selling (red) volume, with bar length reflecting volume intensity.
The indicator supports strategies like identifying support and resistance levels, breakout analysis (trend direction based on VAH and VAL breaks), and entry points (buy near VAL with buyer volume, sell near VAH with seller volume, or fade at profile extremes).
Recommended settings vary by trading style: for day trading, shorter periods and narrower profiles; for swing trading, longer periods and wider profiles. This tool aids in visualizing liquidity, market intent, and volume imbalances to inform trading decisions.
カスタマーレビュー
5 | 0 % | |
4 | 50 % | |
3 | 50 % | |
2 | 0 % | |
1 | 0 % |


