


설명
⚡ CoreQuant Nasdaq 유동성 지도 Pro — 기관 NQ 세션 및 ICT 실행 프레임워크
기관 주문 흐름을 마스터하고 높은 확률의 유동성 스윕을 거래하세요 CoreQuant Nasdaq Liquidity Map Pro — cTrader에서 Nasdaq (NQ, US100, USTEC) 및 지수 트레이더를 위해 특별히 설계된 올인원 자동 세션 매핑 및 ICT/SMC 실행 스위트입니다.
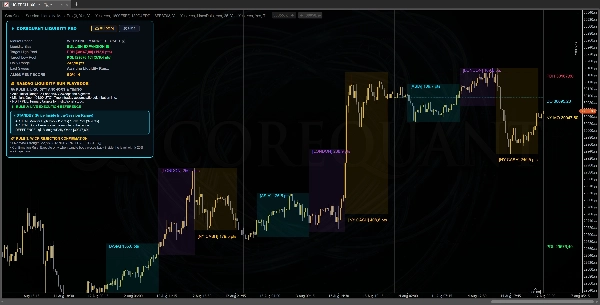
수동 차트 준비를 제거하세요. CoreQuant는 동적 세션 범위를 자동으로 계산하고, 뉴욕 오픈 드라이브로 수평 유동성 광선을 투사하며, 인터랙티브 온차트 HUD를 통해 실시간 심지 흡수 지표를 제공합니다.
🎯 주요 기관 기능
- 100% 네이티브 Nasdaq 포인트 엔진 (
pts): 모든 세션 범위, 목표 풀 거리 및 동적 위험 지표가 지수 포인트로 네이티브 계산되어 파이프 혼동이 없습니다. - 자동 3세션 유동성 박스:
-
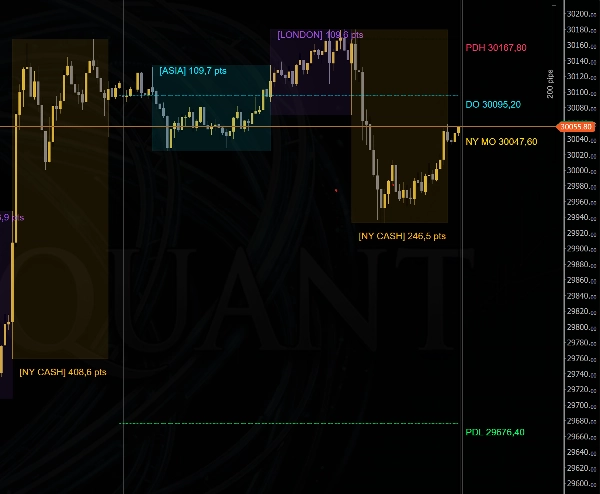
- 아시아 축적 범위 (00:00–08:00 UTC): 초기 유동성 경계를 시각화합니다.
- 런던 세션 범위 (08:00–13:30 UTC): 프리마켓 조작 및 유동성 런을 추적합니다.
- 뉴욕 현금 RTH 박스 (13:30–20:00 UTC): 주요 월가 거래량 창을 강조합니다.
- 확장 세션 유동성 광선: 세션 고점과 저점을 뉴욕 오픈 드라이브로 직접 확장하는 동적 수평 투사로 미해결 풀을 정확히 찾아냅니다.
- 진정한 ICT 데이 앵커 (NY 자정 오픈): 04:00 UTC (00:00 EST) 오픈 가격을 자동으로 차트에 표시하여 일중 축적(할인)과 분배(프리미엄)를 구분합니다.
- 제한된 기관 주요 레벨: 전일 고가(PDH), 전일 저가(PDL), 일일 오픈(DO)에 대해 일일 세션 시작에 엄격히 고정된 정밀 추세선.
- 실시간 심지 흡수 엔진: 조기 진입을 방지하기 위해 최소 $\ge 25\%$ 캔들 심지 거부가 필요한 유동성 스윕을 실시간 수학적으로 감지합니다.
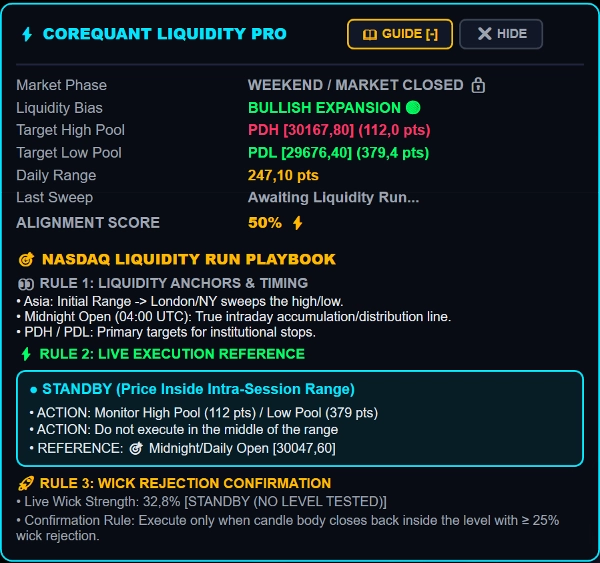
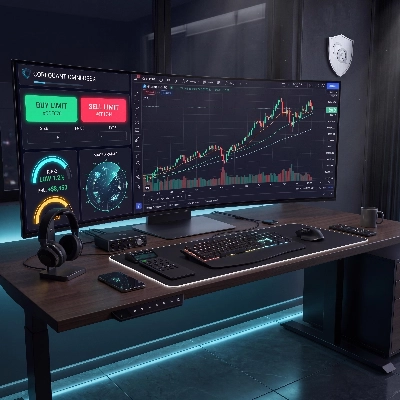
- 인터랙티브 온스크린 실행 HUD: 실시간 Nasdaq 시장 단계 감지기, 동적 유동성 편향, 실시간 풀까지 거리 추적기 및 정렬 점수(%) 제공.
- 1클릭 접이식 터미널: 확장된 3단계 플레이북, 컴팩트 HUD 또는 세련된
⚡ LIQUIDITY [SHOW]미니 버튼으로 즉시 전환하세요.
📖 NASDAQ 플레이북 거래 방법
- 1단계: 주요 목표 풀 식별
NY 프리마켓 및 오프닝 드라이브 동안 미해결 유동성 경계(PDH, PDL, 아시아 고/저, 또는 런던 극한)로 가격 확장을 모니터링하세요. - 2단계: 실시간 설정 참조 및 편향 정렬
-
- 강세 편향 (NY 자정 오픈 위): 세션 저점 또는 PDL에서 낮은 스윕/반전을 찾으세요.
- 약세 편향 (NY 자정 오픈 아래): 세션 고점 또는 PDH에서 높은 스윕/페이드를 찾으세요.
- 목표 로드맵: NY 자정 오픈 또는 일일 오픈에 고정된 동적 이익 실현 참조.
- 3단계: 캔들 심지 확인 및 실행
가격이 레벨을 스윕하고 캔들 몸통이 경계 내로 다시 닫히며 검증된 $\ge 25\%$ 심지 거부가 있을 때만 실행하세요.
⚙️ 사용자 정의 가능한 매개변수
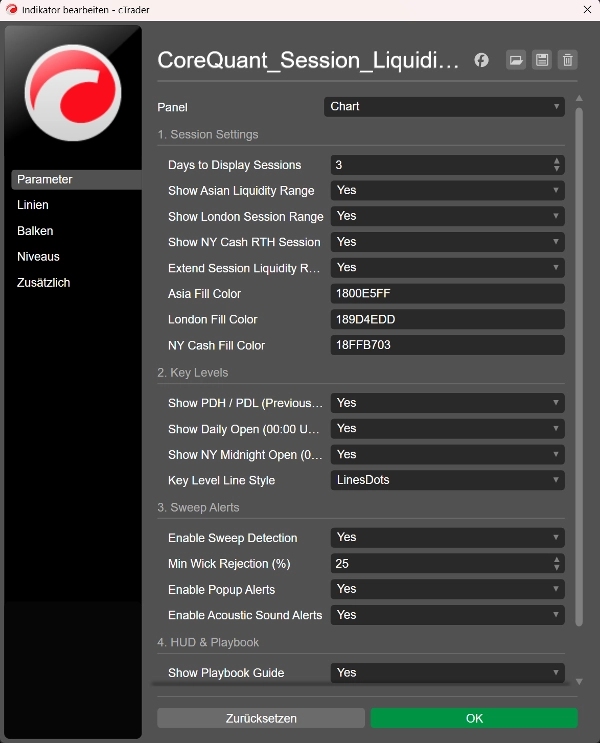
- 세션 기록 깊이: 1~10 거래일 사이의 과거 조회 기간 조정 (기본값: 3일 / 1주 거래일).
- 세션 및 광선 토글: 아시아, 런던, NY 현금 및 확장 유동성 광선에 대한 독립적인 켜기/끄기 스위치.
- 기관 레벨: PDH, PDL, 일일 오픈(00:00 UTC), NY 자정 오픈(04:00 UTC)을 사용자 정의 가능한 선 스타일로 토글.
- 스윕 민감도: 사용자 정의 최소 심지 거부 임계값 설정 (10%~80%).
- 즉시 알림: 실시간 스윕 이벤트에 대한 차트 내 팝업 및 음향 알림 구성 가능.
- 인터페이스 위치 지정: HUD를 차트의 어느 모서리든 (왼쪽 상단, 오른쪽 상단, 왼쪽 하단, 오른쪽 하단) 고정.
📦 포함 사항
- 평생 라이선스 및 즉시 액세스
- 평생 무료 업데이트: 모든 미래 지표 최적화, 알고리즘 업그레이드 및 cTrader 호환성 패치가 영구 포함됩니다.
- 전담 1:1 지원: 설정, 매개변수 조정 및 차트 구성에 대한 직접 개발자 지원.
- 자산 다양성: US TECH 100 / NAS100, US 500, GER40, 금(XAUUSD) 및 외환에 대해 네이티브로 보정됨.
🚀 코드 작성. 거래. 지배. — 오늘 CoreQuant Nasdaq Liquidity Map Pro로 차트를 업그레이드하세요!
요약
AI summary
CoreQuant_Liquidity_Map_Pro is a professional trading indicator designed for the cTrader platform, focusing on institutional order flow and liquidity analysis using ICT and Smart Money Concepts (SMC). It dynamically maps key trading sessions—Asian, London, New York (Forex), and Wall Street (Equities)—highlighting them with clear background boxes and precise pip-range calculations. The indicator anchors critical market levels such as Previous Day High (PDH), Previous Day Low (PDL), and Daily Open to the chart’s right edge for clarity.
Key features include a live liquidity sweep engine that detects real-time sweeps of PDH and PDL with visual markers and customizable audio alerts. An interactive on-screen HUD provides session tracking, range monitoring, countdowns, and an integrated ICT liquidity trading playbook. The tool also offers smart weekend compression to reduce chart clutter while preserving essential reference levels.
Users can customize session times, toggle key levels, adjust label positioning, and configure alert sounds. The HUD layout is flexible, allowing placement in any chart corner or minimization.
This indicator is suited for traders employing Smart Money Concepts, ICT strategies, breakout/fade techniques, and price action scalping. It supports high-volatility indices (e.g., NAS100, US500, GER40), Gold (XAUUSD), Forex pairs, and cryptocurrencies, optimized for M1, M5, M15, and H1 timeframes. It accommodates both personal and prop firm challenge accounts requiring precise risk management.
Key features include a live liquidity sweep engine that detects real-time sweeps of PDH and PDL with visual markers and customizable audio alerts. An interactive on-screen HUD provides session tracking, range monitoring, countdowns, and an integrated ICT liquidity trading playbook. The tool also offers smart weekend compression to reduce chart clutter while preserving essential reference levels.
Users can customize session times, toggle key levels, adjust label positioning, and configure alert sounds. The HUD layout is flexible, allowing placement in any chart corner or minimization.
This indicator is suited for traders employing Smart Money Concepts, ICT strategies, breakout/fade techniques, and price action scalping. It supports high-volatility indices (e.g., NAS100, US500, GER40), Gold (XAUUSD), Forex pairs, and cryptocurrencies, optimized for M1, M5, M15, and H1 timeframes. It accommodates both personal and prop firm challenge accounts requiring precise risk management.
지표 프로필
지표 카테고리
시장 구조 (SMC)
출력 유형
시각화
신호
데이터 요구 사항
막대만
지원되는 신호
시가 범위
레벨 돌파
반전
레벨 터치
고객 리뷰
0.0
리뷰: 0
고객 리뷰
이 상품에 대한 리뷰가 아직 없습니다. 이미 사용해 보셨나요? 다른 사람들에게 가장 먼저 소개해 주세요!
상담
자주 묻는 질문(FAQ)
Key Levels
Pin Bar
Liquidity Sweep
Inducement
Market Structure
Liquidity Grab
Support & Resistance
트레이딩 봇, 지표, 플러그인 등 cTrader Store에서 제공되는 상품은 제3자 개발자에 의해 제공되며, 이는 단순히 정보 및 기술적 접근을 목적으로 제공된 것입니다. cTrader Store는 중개인이 아니며, 투자 조언, 개인별 추천 또는 향후 성과에 대한 어떠한 보장도 제공하지 않습니다.
이 작성자의 상품 더 보기




















가격
2
판매