
PriceLevels
Indikator
4 käufe
Version 1.0, Jan 2025
Windows, Mac
5.0
Bewertungen: 2
Beschreibung
Hauptmerkmale:
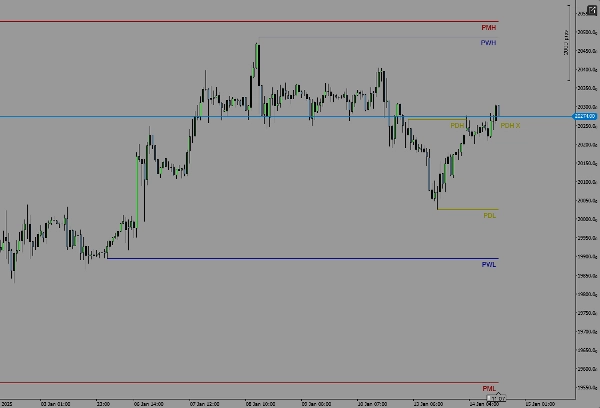
- Zeigt die Hoch- und Tiefststände von gestern an.
- Zeigt die Hoch- und Tiefststände der letzten Woche an.
- Zeigt die Hoch- und Tiefststände des letzten Monats an.
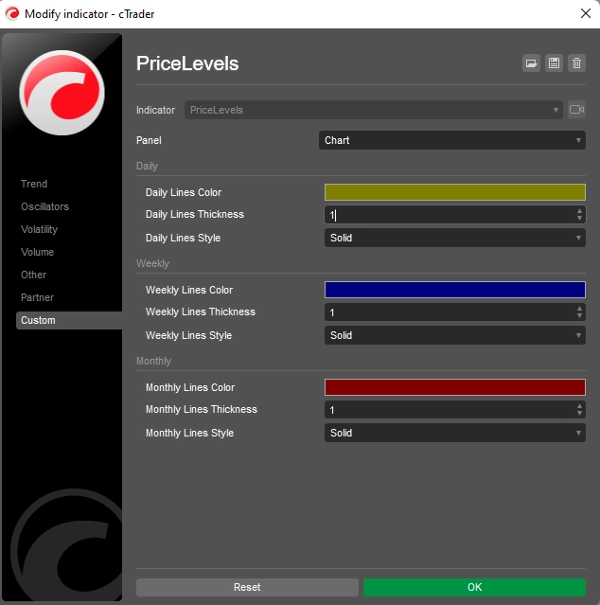
- Anpassbare Farben und Linienarten für jede Ebene.
Funktionsweise:
Der Indikator berechnet automatisch die höchsten und niedrigsten Preise des vorherigen Tages, der Woche und des Monats basierend auf dem Zeitrahmen Ihres Charts. Diese Niveaus werden dann als horizontale Linien in Ihrem Chart dargestellt und bieten eine klare visuelle Referenz für historische Kursbewegungen.
Kompatibilität:
- Nur für die cTrader-Plattform entwickelt.
- Funktioniert auf allen Zeitrahmen und Instrumenten.
Wenn Sie Fragen, Feedback oder Verbesserungsvorschläge haben, zögern Sie nicht, sich zu melden! Ihr Input ist sehr wertvoll und wird dazu beitragen, diesen Indikator noch besser zu machen.
Viel Erfolg beim Trading!
Zusammenfassung
KI-Zusammenfassung
PriceLevels is an indicator designed for the cTrader platform that automatically calculates and displays key historical price levels on trading charts. It plots the highest and lowest prices from the previous day, last week, and last month as horizontal lines, providing traders with clear visual references for past price action. The indicator supports all timeframes and instruments available on cTrader. Users can customize the colors and line styles for each displayed level to suit their charting preferences. This tool aids in identifying significant support and resistance zones based on recent historical data.
Indikatorprofil
Kundenbewertungen
5.0
Bewertungen: 2
5 | 100 % | |
4 | 0 % | |
3 | 0 % | |
2 | 0 % | |
1 | 0 % |
Diskussion
Häufig gestellte Fragen (FAQ)
Über den cTrader Store verfügbare Produkte, einschließlich Handelsbots, Indikatoren und Plugins, werden von externen Entwicklern bereitgestellt und nur zu Informations- und technischen Zugriffszwecken verfügbar gemacht. cTrader Store ist kein Broker und erbringt keine Anlageberatung, persönlichen Empfehlungen oder eine Garantie für zukünftige Performance.


Preis
Seit 05/01/2025
14
Verkäufe