

Beschreibung
Diejenigen, die mit dem Handel zu tun haben, wissen, wie wichtig es ist, die vorherige Sitzung zu berücksichtigen.
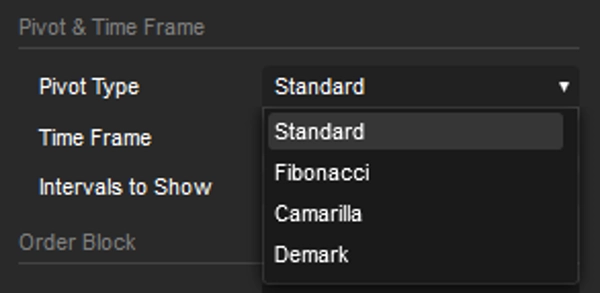
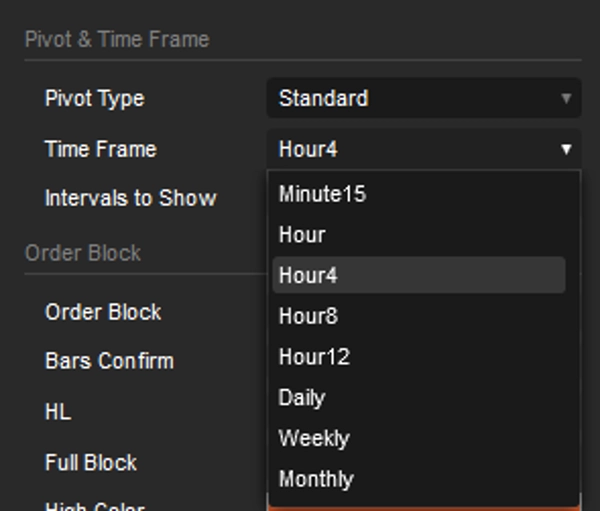
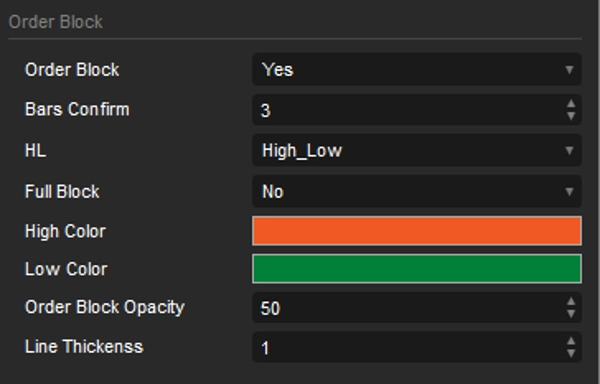
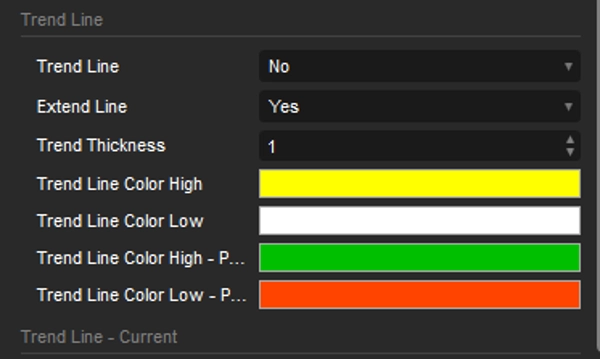
Ich habe diesen Pivot-Indikator vorbereitet, mit Intervallen von 15 Minuten bis zu einem Monat, und er beinhaltet Orderblöcke und Trendlinien. Beide Optionen basieren auf den höchsten und niedrigsten Punkten der vorherigen Sitzung.
Die Standardkonfiguration ist auf einen 5-Minuten-Zeitrahmen eingestellt.
Der Pivot ist auf 4 Stunden eingestellt, und das Intervall ist 5, was bedeutet, dass er 20 Stunden in 4-Stunden-Intervallen zurückblickt. Das ist perfekt für diejenigen, die täglich handeln.
Wenn Sie jedoch ein Fan von Swing Trading sind, müssen Sie nur das Pivot-Intervall ändern; alles andere passt sich automatisch an.
Orderblöcke heben potenzielle Bereiche hervor, in denen der Preis Unterstützung oder Widerstand finden könnte, und bieten Einblicke in mögliche Umkehrungen oder Fortsetzungen. Durch die Kombination mit den automatisch generierten Trendlinien für den gewählten Zeitraum können Händler die potenzielle Kursrichtung und mögliche Ein- oder Ausstiegspunkte genauer identifizieren. Die Möglichkeit, diese Trendlinien über mehrere Zeitrahmen hinweg zu visualisieren, bietet ein umfassenderes Verständnis der Marktstruktur.
Mit zusätzlichen Werkzeugen wie
OrderPrice V3 https://ctrader.com/products/397
NTMPICLL https://ctrader.com/products/327
Range Box Level https://ctrader.com/products/245
Or RangeBoxFibonacci https://ctrader.com/products/526
Market Session https://ctrader.com/products/94
MacdVolume https://ctrader.com/products/267
4MA https://ctrader.com/products/247
Sie werden unbesiegbar sein
Viel Glück 😀
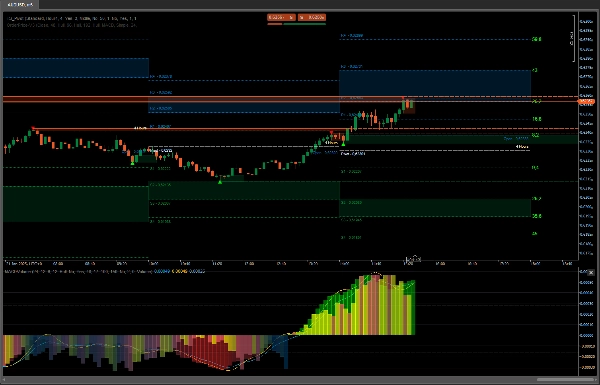
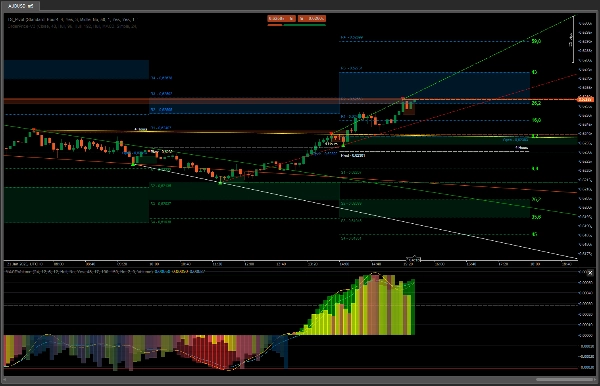
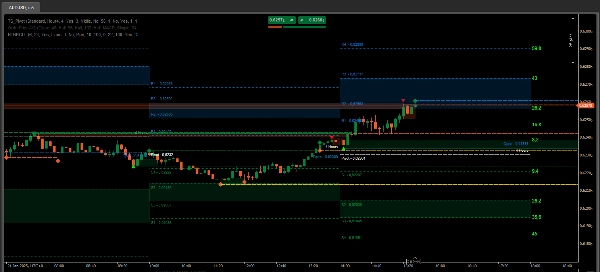
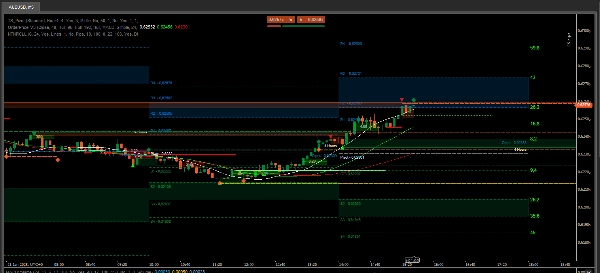
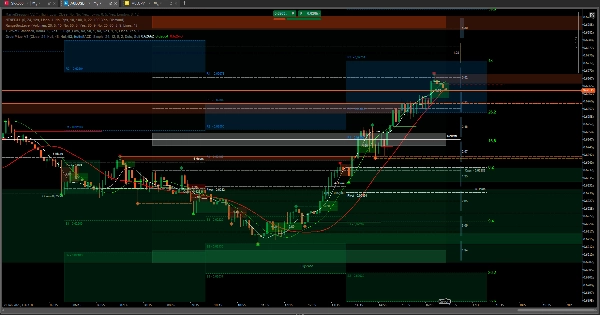
Im Falle eines Kaufs, wenn man die letzten zwei Bilder betrachtet, das Verhalten von OrderPrice und den integrierten gleitenden Durchschnitten, ist der perfekte Moment, um eine Kauftransaktion zu eröffnen, wenn eine grüne Linie erscheint und der gleitende Durchschnitt darunter liegt.
Mit den Daten der vorherigen Sitzung können Sie bestimmen, wie weit der Preis gehen könnte oder wo Widerstand auftreten könnte. Wenn er durchbricht, könnte er zum zweiten Punkt weitergehen, der die neutrale Zone von RangeBoxLevel sein könnte. Wenn er das überschreitet und keine Anzeichen dafür vorliegen, dass die gleitenden Durchschnitte die Richtung ändern wollen, könnte der Preis die Orderblock-Zone der vorherigen Sitzung erreichen.
Im letzten Bild gibt es einen Screenshot einer perfekten Situation zum Ein- und Ausstieg aus einer Transaktion. Der Rest besteht nur darin, zu beobachten und Schlüsse zu ziehen.
Diese Werkzeuge sind unerlässlich, wenn es darum geht, durch Asset-Handel zu gewinnen.
Zusammenfassung
Key features include the integration of order blocks and trend lines derived from previous session data. Order blocks identify potential support and resistance zones, aiding in spotting possible price reversals or continuations. The indicator automatically generates trend lines for the selected timeframe, helping traders assess market structure and potential price direction. Visualizing these trend lines across multiple timeframes enhances market analysis.
TS_Pivot can be used alongside complementary tools such as OrderPrice V3, NTMPICLL, Range Box Level, RangeBoxFibonacci, Market Session, MacdVolume, and 4MA to refine entry and exit decisions. By combining moving averages and order block signals, traders can identify optimal moments to open buy or sell positions. The indicator supports various markets including Forex, cryptocurrencies, commodities, indices, and stocks.
Kundenbewertungen
5 | 100 % | |
4 | 0 % | |
3 | 0 % | |
2 | 0 % | |
1 | 0 % |


![„High-Low Divergence [Iridio Capital]“-Logo](https://cdn.ctrader.com/image/webp/443c4661-7abb-40f1-842f-4b6ec560649b_40914)


