present
ลงทะเบียนและรับส่วนลด $50 สำหรับการซื้อครั้งแรกของคุณ
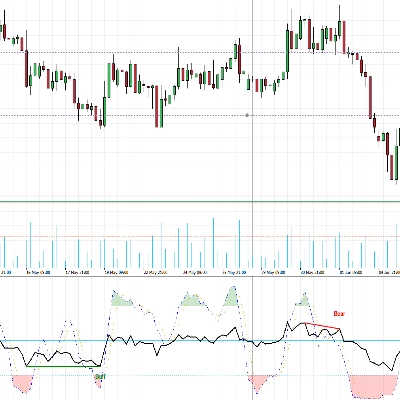
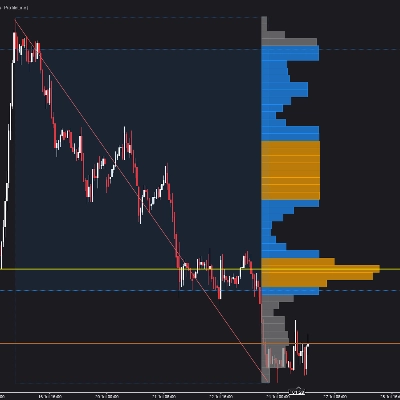
Trading product for IR Macd on Chart อินดิเคเตอร์ MACD, image 1
IR Macd on Chart
5.0
รีวิว: 1
5.64K
ติดตั้งฟรี

คำอธิบาย

ตัวบ่งชี้นี้แสดง MACD บนแผนภูมิ

สรุป

สรุปโดย AI
IR Macd on Chart is a trading indicator that displays the Moving Average Convergence Divergence (MACD) directly on the price chart. It provides a visual representation of the MACD, a momentum indicator used to identify trend direction and potential reversals by showing the relationship between two moving averages of a security’s price. This indicator integrates the MACD histogram and signal line within the chart interface, enabling traders to analyze momentum without switching views. It supports standard MACD functionality and is categorized under momentum indicators.
โปรไฟล์อินดิเคเตอร์

การสนทนา

รีวิวจากลูกค้า

5.0
รีวิว: 1
5
100 %
4
0 %
3
0 %
2
0 %
1
0 %
รีวิวจากลูกค้า
April 15, 2025
ok

คำถามที่พบบ่อย

MACD
ผลิตภัณฑ์ที่มีให้บริการผ่าน cTrader Store รวมถึงบอทการเทรด อินดิเคเตอร์ และปลั๊กอิน มีให้บริการโดยนักพัฒนาบุคคลที่สามและมีไว้เพื่อวัตถุประสงค์ในการเข้าถึงข้อมูลและทางเทคนิคเท่านั้น cTrader Store ไม่ใช่โบรกเกอร์และไม่ได้ให้คำแนะนำการลงทุน คำแนะนำส่วนบุคคล หรือการรับประกันผลการดำเนินงานในอนาคต


เพิ่มเติมจากผู้เขียนคนนี้

"IR Candle MTF" โลโก้
4.6
(6)
ฟรี
with this indicator you could see other time frame candle in your chart.
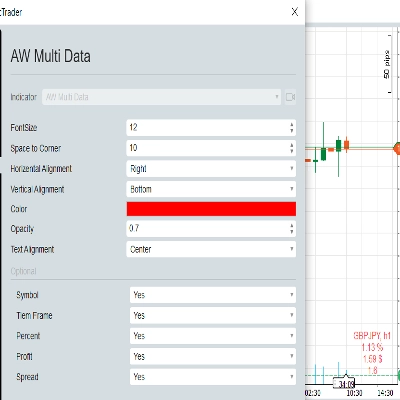
show spread on chart
some user add moving average to macd to see better. in ctrader 4.3.11 there is a problem with this . I make a macd tha
Multi Time Frame Moving Average is a powerful and flexible indicator for cTrader
 this moving include everything that a trader needs from Moving Average.
this indicaotr show distance between Tenkan to Kijun, Close to Kijun and Close to Tenkan 
Add Slowing to IR Moving Average.
IR Candle Open plots customizable opening price lines for daily, weekly, and monthly candles
Coral indicator
you could put your check list in your chart you could split your test with “,” you could put your checklist in indicat
this indicator show other time frame close in lower time frame. for ex: show daily close in m 15.
don't move to the end of chart after timeframe changing. it should be better to use for near history. for long history

นอกจากนี้คุณยังอาจชอบ

The Tenkan-ATR Indicator is a powerful and innovative indicator for Traders. SALE OFF!!!
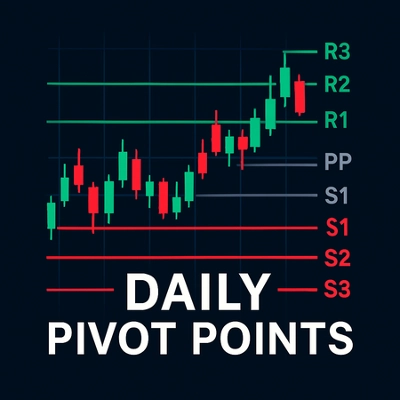
Daily Pivot Points plots key support and resistance levels to guide precise trading decisions.
Opening ranges, dynamic trend channels, and multi-scale breakout/retest analysis for clear intraday chart decisions.
VWAP Pro – The Ultimate VWAP 💎💰
Trading.FC$_vwap Algo shows VWAP trends, dynamic support/resistance and deviation bands to spot potential trade entries.
RSI on the main chart with 45/55 momentum levels, overbought/oversold levels, averaged RSI, and multi-timeframe support.
"FX Sniper" โลโก้
4.7
(7)
$20
/
$40
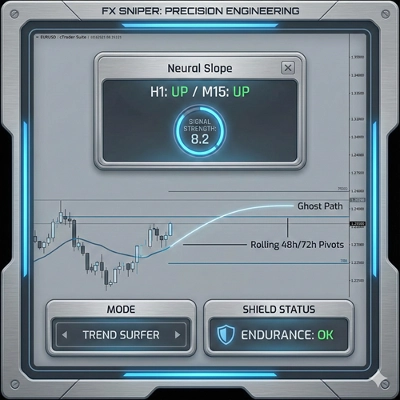
FX Sniper: Multi-pair Forex analysis tool. Features trend logic, adaptive pivots, and momentum filtering for major pairs
"Auto Chart Patterns" โลโก้
4.5
(7)
$19
/
$25
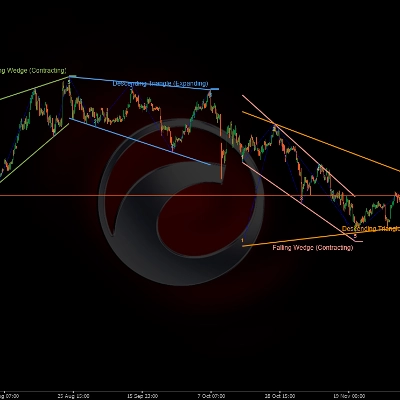
🎯Automatically detects and visualizes classical chart patterns using multi-timeframe swing point analysis.
[Hamster-Coder] Pivot Points (Multi Time Frame)
Auto Fibonacci Retracement Pro – Smart Swing & Golden Zone Levels
Unlock Stochastic RSI PRO in cTrader! Overlay RSI, highlight zones, and identify divergences with customizable settings.
"ATR Bands" โลโก้
4.7
(4)
$19
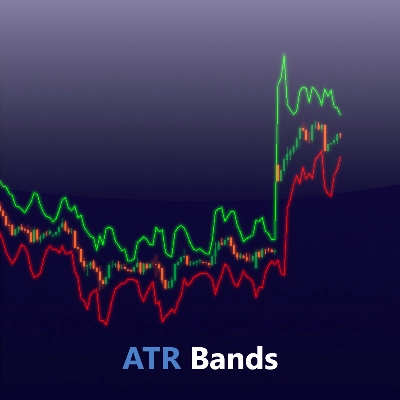
Enhance trading with ATR Bands! Visualize market volatility using dynamic upper and lower ATR bands for precise decision
Customize your Moving Average! Choose any timeframe and price source for precision and flexibility in your analysis.
"MACARX 2026 ULTRA" โลโก้
4.2
(5)
$20
/
$25
🚀 MACARX Indicator - The Multi-Indicator Trend Fusion 🚀
Volume profile indicator that auto-detects the latest trendline. Shows POC, Value Area (VAH/VAL), and High Volume Nodes
VWAP Bands indicator with 3 standard deviation levels, buy/sell zones, and a draggable ON/OFF button to toggle the entir
Nine timeframe cards, vivid candles, native BUY/SELL arrows and adjustable ATR-buffer stop-loss reference lines.
🚀📈 Plot buy/sell signals on Range Bars using Moving Averages and RSI. Clear, actionable trading insights.🚀📈

ราคา

5.64K
ติดตั้งฟรี