present
سجل واحصل على خصم 50 دولارًا على مشترياتك الأولى
Trading product for IR Close MTF مؤشر, image 1
IR Close MTF
5.0
التقييمات: 1
5.64K
التثبيتات المجانية

الوصف

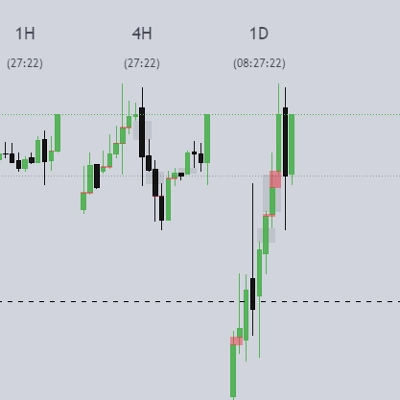
هذا المؤشر يعرض إغلاق إطار زمني آخر في إطار زمني أقل. على سبيل المثال: عرض الإغلاق اليومي في M15.


الملخص

ملخص الذكاء الاصطناعي
IR Close MTF is a trading indicator designed to display the closing price of a higher time frame on a lower time frame chart. For example, it can show the daily close price while viewing a 15-minute chart. This functionality allows traders to easily reference key price levels from different time frames within a single chart, aiding in multi-time frame analysis. The indicator supports various time frame combinations, enhancing situational awareness without switching charts.
ملف تعريف المؤشر

مناقشة

تقييمات العملاء

5.0
التقييمات: 1
5
100 %
4
0 %
3
0 %
2
0 %
1
0 %
تقييمات العملاء
September 30, 2025

الأسئلة الشائعة

يتم توفير المنتجات المتاحة من خلال cTrader Store، بما في ذلك روبوتات التداول والمؤشرات والإضافات، من قبل مطوري الطرف الثالث وإتاحتها لأغراض الوصول المعلوماتي والفني فقط. cTrader Store ليس وسيطًا ولا يقدم نصائح استثمارية أو توصيات شخصية أو أي ضمان للأداء المستقبلي.


المزيد من هذا المؤلف

شعار "IR Candle MTF"
4.6
(6)
مجاني
with this indicator you could see other time frame candle in your chart.
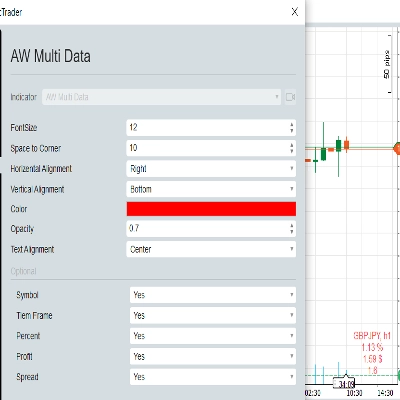
show spread on chart
some user add moving average to macd to see better. in ctrader 4.3.11 there is a problem with this . I make a macd tha
this indicator show macd on chart.
Multi Time Frame Moving Average is a powerful and flexible indicator for cTrader
 this moving include everything that a trader needs from Moving Average.
this indicaotr show distance between Tenkan to Kijun, Close to Kijun and Close to Tenkan 
Add Slowing to IR Moving Average.
IR Candle Open plots customizable opening price lines for daily, weekly, and monthly candles
Coral indicator
you could put your check list in your chart you could split your test with “,” you could put your checklist in indicat
don't move to the end of chart after timeframe changing. it should be better to use for near history. for long history

قد يعجبك أيضًا

View tick activity across a selected chart range with Point of Control, Value Area High and Value Area Low.
The Break of Structure (BoSCHoCh) Indicator is a smart market structure tool designed to help traders easily spot trend.
GOLD SENTINEL v1.0 - A CANDLE-COLORING INDICATOR FOR GOLD.
A comprehensive workflow‑enhancement toolkit designed to make charting on cTrader smoother, clearer, and more efficient.
Strong Supertrend Turn Market Movement into a Clear Map Market analysis
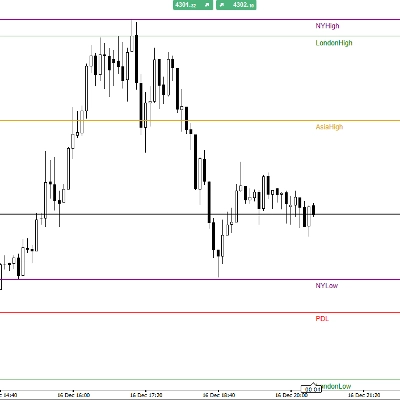
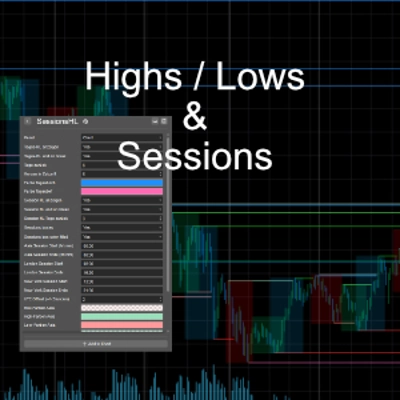
PDL/PDH/PWL/PWH and Session higs/lows (customizable)
شعار "CVD"
4.6
(3)
$20
/
$30
Cumulative Volume Delta tracks the net difference in tick volume between buying and selling pressure over time
Easy Trade: Trend & Breakout Indicator for cTrader
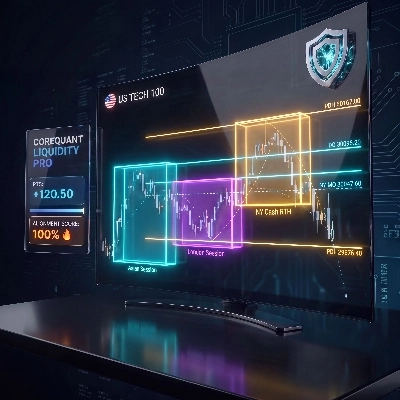
Institutional Nasdaq Session Liquidity Map with Live Point HUD, Sweep Alerts & Interactive Playbook.
شعار "Auto Chart Patterns"
4.5
(7)
$19
/
$25
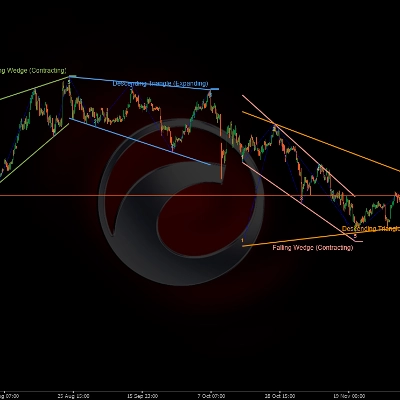
🎯Automatically detects and visualizes classical chart patterns using multi-timeframe swing point analysis.
ICT HTF Candles- The Ultimate Multi-Timeframe Dashboard Stop switching timeframes and losing focus.
📊Predicts price movement by combining multi-timeframe trend analysis, market volatility 📉, and..
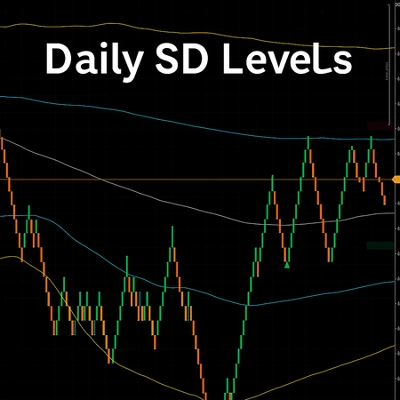
Dynamic VWAP with ±1/±2 Standard Deviation Bands for intraday volatility, extremes and mean reversion.
Shows daily and sessions highs / lows and session boxes, everything configurable
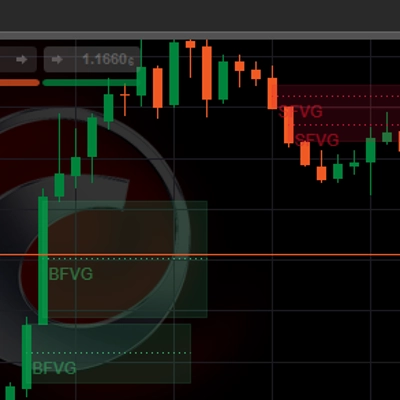
Automatically detects and highlights both Bullish and Bearish Fair Value Gaps (FVGs).
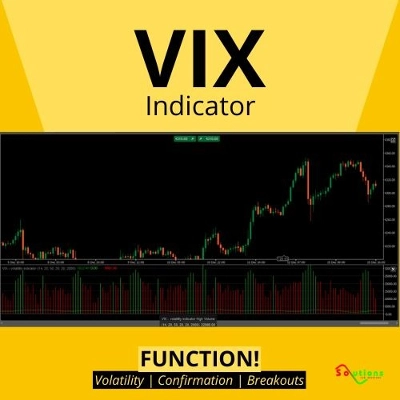
VIX Pro: Confirm Real Breakouts & Filter Market Noise with Volatility
Map market structure, order blocks, liquidity and key zones with an interactive cTrader dashboard.
Unlock market insights with our Multi-Timeframe Market Levels indicator, enhancing your trading strategies effortlessly

السعر

5.64K
التثبيتات المجانية