present
ลงทะเบียนและรับส่วนลด $50 สำหรับการซื้อครั้งแรกของคุณ
Trading product for IR Ichimoku Macd อินดิเคเตอร์, image 1
IR Ichimoku Macd
5.0
รีวิว: 1
5.63K
ติดตั้งฟรี

คำอธิบาย

ตัวชี้วัดนี้แสดงระยะห่างระหว่าง Tenkan ถึง Kijun, ปิดใกล้ Kijun และ ปิดใกล้ Tenkan 


สรุป

สรุปโดย AI
The IR Ichimoku Macd indicator displays the distances between key Ichimoku components: Tenkan to Kijun, Close to Kijun, and Close to Tenkan. It provides a visual measure of the relative positioning of these elements, which are commonly used in technical analysis to assess market trends and momentum. This indicator helps traders evaluate the relationship between price and Ichimoku lines for potential trading signals.
โปรไฟล์อินดิเคเตอร์

การสนทนา

รีวิวจากลูกค้า

5.0
รีวิว: 1
5
100 %
4
0 %
3
0 %
2
0 %
1
0 %
รีวิวจากลูกค้า
August 18, 2025
Pros: Combines Ichimoku and MACD for both trend and momentum analysis. Flexible settings and clear visualization. Cons: No alerts, MTF mode, or preset saving. Can be resource-heavy on low-end PCs.

คำถามที่พบบ่อย

ผลิตภัณฑ์ที่มีให้บริการผ่าน cTrader Store รวมถึงบอทการเทรด อินดิเคเตอร์ และปลั๊กอิน มีให้บริการโดยนักพัฒนาบุคคลที่สามและมีไว้เพื่อวัตถุประสงค์ในการเข้าถึงข้อมูลและทางเทคนิคเท่านั้น cTrader Store ไม่ใช่โบรกเกอร์และไม่ได้ให้คำแนะนำการลงทุน คำแนะนำส่วนบุคคล หรือการรับประกันผลการดำเนินงานในอนาคต


เพิ่มเติมจากผู้เขียนคนนี้

"IR Candle MTF" โลโก้
4.6
(6)
ฟรี
with this indicator you could see other time frame candle in your chart.
show spread on chart
some user add moving average to macd to see better. in ctrader 4.3.11 there is a problem with this . I make a macd tha
this indicator show macd on chart.
Multi Time Frame Moving Average is a powerful and flexible indicator for cTrader
 this moving include everything that a trader needs from Moving Average.
Add Slowing to IR Moving Average.
IR Candle Open plots customizable opening price lines for daily, weekly, and monthly candles
Coral indicator
you could put your check list in your chart you could split your test with “,” you could put your checklist in indicat
this indicator show other time frame close in lower time frame. for ex: show daily close in m 15.
don't move to the end of chart after timeframe changing. it should be better to use for near history. for long history

นอกจากนี้คุณยังอาจชอบ

SMC Pro Suite: OBs, FVGs, Structure, Liquidity, Killzones & MTF overlay. Every concept in one cTrader indicator.
high and low
MMXM Structure by LudwigICT – Professional Market Structure Mapping Tool
Orderblocks with Multi-Timeframe.
"SCOB" โลโก้
4.4
(5)
$19
/
$20
SCOB - Single Candle Order Block Indicator
"Supertrend-algo" โลโก้
4.3
(3)
$19
/
$29
Algorithmic trend precision for cTrader.
Advanced MA crossover indicator. All MA types supported. Clear signals with customizable arrows Perfect for all trader
"OR Session Zones" โลโก้
4.2
(5)
$25
/
$45
A high‑precision Opening Range indicator that detects session opens (NY, London, EU, Tokyo, Shanghai)
Angora Pattern Recognition is a cTrader indicator that finds, draws and tracks classic chart patterns automatically.
"Pivot Point Daily Indicator" โลโก้
4.2
(4)
$20
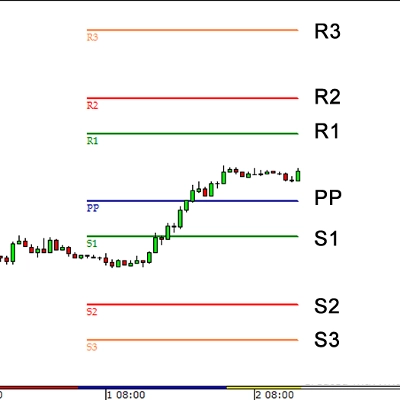
Pivot Points Standard — All-in-One Multi-Timeframe Pivot Indicator for cTrader
Protect your funded account. Real-time Daily Equity Drawdown monitor with Green / Orange / Red flashing alerts.
Explore 88 harmonic price-pattern variants with interactive chart controls and geometric reference levels.
Map market structure, order blocks, liquidity and key zones with an interactive cTrader dashboard.
MarketStructurePro – Smart BOS/CHoCH
"Swing AVWAP Pro" โลโก้
5.0
(4)
$29
/
$49
Adaptive Swing-Anchored VWAP that tracks market structure shifts with precision and clarity.
NTNPICLL is a tool to check the best trading hours for the assets and also includes the highest and lowest point
ICT Order Block Advanced
VWAP Bands indicator with 3 standard deviation levels, buy/sell zones, and a draggable ON/OFF button to toggle the entir

ราคา

5.63K
ติดตั้งฟรี