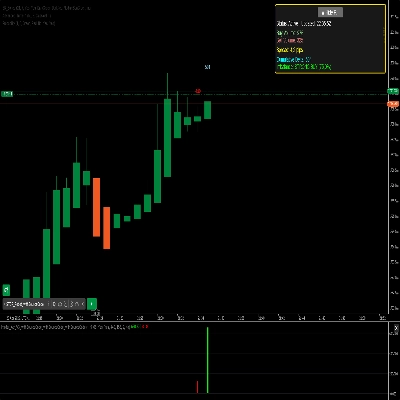
"IR Macd + MacdLine" โลโก้
IR Macd + MacdLine
5.0
03/09/2025
240
Desktop
เพิ่มเติมจากผู้เขียนคนนี้
เรตติ้งสูง
IR Candle MTF
with this indicator you could see other time frame candle in your chart.
IR Macd on Chart
this indicator show macd on chart.
IR Moving Average
 this moving include everything that a trader needs from Moving Average.
IR Ichimoku Macd
this indicaotr show distance between Tenkan to Kijun, Close to Kijun and Close to Tenkan 
IR Slowing Moving
Add Slowing to IR Moving Average.
IR CheckList
you could put your check list in your chart you could split your test with “,” you could put your checklist in indicat
IR Moving MTF
multi time frame moving averge. you could choose different type of price like median ,high and ... and differnt type of
IR VLine
don't move to the end of chart after timeframe changing. it should be better to use for near history. for long history
IR Multi Data
show symbol and time fram, daily net profit percent, daily net profit, and spread ln your chart. consider that timezone
IR Close MTF
this indicator show other time frame close in lower time frame. for ex: show daily close in m 15.
IR Candle Open
IR Candle Open plots customizable opening price lines for daily, weekly, and monthly candles
IR Open Connector
This indicator connects the opening prices of higher timeframe candles (Daily, Weekly, Monthly, or
นอกจากนี้คุณยังอาจชอบ
DynamicVolumeSupplyDemand
Supply and Demand Zones
StochasticRSI
Stochastic RSI (StochRSI) is a technical indicator used to measure the strength and weakness of the RSI.
Atlas Seasonal Returns Heatmap
🧭 See when your market tends to move—by Month, Day-of-Week, or Hour-of-Day🧭
ยอดนิยม
Pivot Points
Pivot Points Indicator
OHLC PRO by LudwigICT
OHLC PRO – Advanced Session & Market Structure Tool
ยอดนิยม
trPDHLC
this indicator shows previous day high low and closed with precise manner.
Candle Timer & Strength Panel Demo -
Candle Timer & Strength Panel DEMO for cTrader DEMO VERSION – 24 hours free trial! This is a DEMO version of the Candle
Round Numbers
Automatically draws major, minor, and trace support/resistance levels at round numbers
ยอดนิยม
Fractals
Fractals is a precision-engineered trading indicator for cTrader that reveals the hidden architecture of price action.
On Balance Volume USD - Combined
See USD demand in one line—Composite OBV fuses six major FX pairs into a clear momentum gauge.
ZigZag Price Liquidity Projection
📊 ZigZag Liquidity Projection: Predict bounces/breaks using pivots, ATR & volume.
4MA
This indicator consists of 3 moving averages that can be configured to your liking, from the type of moving average....
Ctrader Liniar Chart
Simple and efficient Indicator Designed to be profitable .With alarms for trend changes and support - resistance
AutoLines™ Support & Resistance
FlexSR auto‑detects pivot highs/lows to plot dynamic support & resistance lines Features customizable styling and option
TwoSMA.cs
An indicator that accurately shows the trend direction. A vital tool for clear trading decisions.
LT Flexible Volume Profile
Flexible Volume Profile, designed with performance in mind.
เรตติ้งสูง
VGM - Auto Fibo Retracement
Auto Fibonacci Retracement Indicator.