present
ลงทะเบียนและรับส่วนลด $50 สำหรับการซื้อครั้งแรกของคุณ
Trading product for IR Slowing Moving อินดิเคเตอร์, image 1
IR Slowing Moving
5.0
รีวิว: 1
5.63K
ติดตั้งฟรี

คำอธิบาย

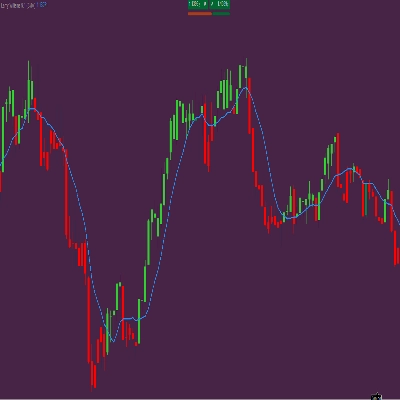
เพิ่มการชะลอให้กับค่าเฉลี่ยเคลื่อนที่ IR

สรุป

สรุปโดย AI
IR Slowing Moving is a trading indicator that enhances the IR Moving Average by adding a slowing component. This modification aims to smooth the moving average calculation, potentially reducing noise and improving trend identification. The indicator is designed for use within trading platforms that support custom indicators, providing traders with an adjusted moving average tool to assist in market analysis.
โปรไฟล์อินดิเคเตอร์

การสนทนา

รีวิวจากลูกค้า

5.0
รีวิว: 1
5
100 %
4
0 %
3
0 %
2
0 %
1
0 %
รีวิวจากลูกค้า
August 18, 2025
Smooths market noise, customizable, stable performance. Cons: No alerts, lags on low TFs, lacks visual trend highlighting.

คำถามที่พบบ่อย

ผลิตภัณฑ์ที่มีให้บริการผ่าน cTrader Store รวมถึงบอทการเทรด อินดิเคเตอร์ และปลั๊กอิน มีให้บริการโดยนักพัฒนาบุคคลที่สามและมีไว้เพื่อวัตถุประสงค์ในการเข้าถึงข้อมูลและทางเทคนิคเท่านั้น cTrader Store ไม่ใช่โบรกเกอร์และไม่ได้ให้คำแนะนำการลงทุน คำแนะนำส่วนบุคคล หรือการรับประกันผลการดำเนินงานในอนาคต


เพิ่มเติมจากผู้เขียนคนนี้

"IR Candle MTF" โลโก้
4.6
(6)
ฟรี
with this indicator you could see other time frame candle in your chart.
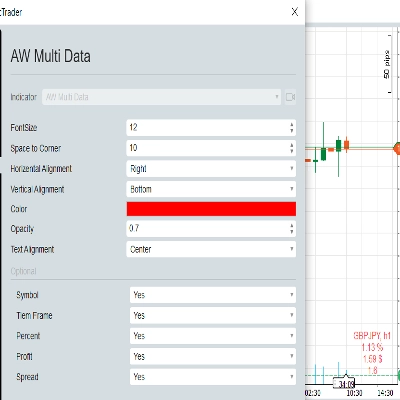
show spread on chart
some user add moving average to macd to see better. in ctrader 4.3.11 there is a problem with this . I make a macd tha
this indicator show macd on chart.
Multi Time Frame Moving Average is a powerful and flexible indicator for cTrader
 this moving include everything that a trader needs from Moving Average.
this indicaotr show distance between Tenkan to Kijun, Close to Kijun and Close to Tenkan 
IR Candle Open plots customizable opening price lines for daily, weekly, and monthly candles
Coral indicator
you could put your check list in your chart you could split your test with “,” you could put your checklist in indicat
this indicator show other time frame close in lower time frame. for ex: show daily close in m 15.
don't move to the end of chart after timeframe changing. it should be better to use for near history. for long history

นอกจากนี้คุณยังอาจชอบ

Volume Profile + VWAP with Standard Deviations
Designed exclusively for trading the Gold market (XAUUSD), GoldMasterIndicator provides institutional-grade technical!
Don't trust static support and resistance levels, this indicator combines Fibonacci and VWAP in one powerful tool.
Version 1.2: Advanced Trend Detection & Visualization System
Larry Williams 9.1
Nine timeframe cards, vivid candles, native BUY/SELL arrows and adjustable ATR-buffer stop-loss reference lines.
Super Trend Rsi ,ATR + trend change distance + dynamic Alpha, divergence/convergence
"Dynamic Swing Anchored VWAP" โลโก้
4.6
(3)
$49
Dynamic Swing Anchored VWAP
Custom your Renko Brick how do you wish!
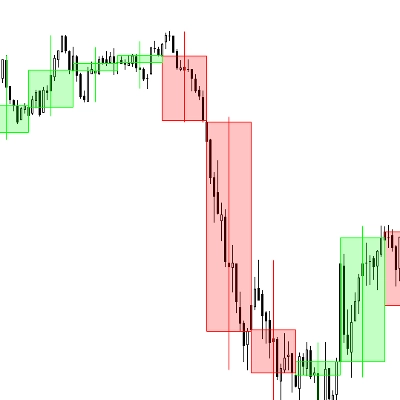
Captra High TF Plotter visualizes high timeframe Bar on lower timeframe charts, highlighting with bull/bear colors.
Multi-timeframe candlesticks!
"LT Flexible Volume Profile" โลโก้
5.0
(3)
$19
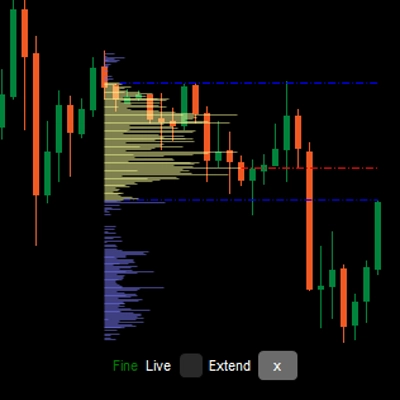
Flexible Volume Profile, designed with performance in mind.
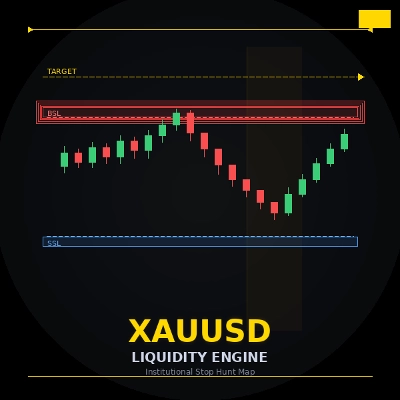
ICT liquidity engine for Gold: maps stop clusters, scores zones & projects the next target. Now with 4 ICT killzones.
EMA Clouds, Multi-Timeframe (MTF) Overlay, Swing High/Low detection, and a smart Dashboard with neutral zone filtering.
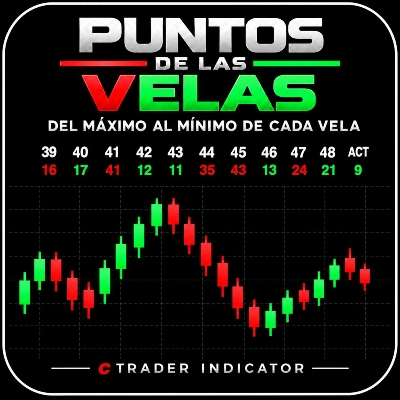
Mide en puntos la distancia entre el Máximo y el Mínimo alcanzados por cada vela, incluida la vela actual.
Institution-level trend Analyzer.
A professional-grade cTrader indicator for traders following the Inner Circle Trader (ICT) methodology.
Configure, simulate, and analyze trading strategies with custom filters, multi-target exits, and detailed performance me

ราคา

5.63K
ติดตั้งฟรี