present
Kaydolun ve ilk alışverişinizde $50 indirim kazanın
Trading product for IR VLine Gösterge, image 1
IR VLine
5.0
Değerlendirmeler: 1
5.64K
Ücretsiz yüklemeler

Açıklama

zaman dilimi değiştirildikten sonra grafiğin sonuna gitmeyin.

yakın geçmiş için kullanmak daha iyi olur. uzun geçmiş için bu gecikme yapar.

Özet

YZ özeti
IR VLine is a chart indicator designed to maintain the current chart position without automatically moving to the end after changing the timeframe. It is optimized for analyzing recent market history, providing timely visual references for near-term data. When applied to longer historical periods, users may experience some delay in updates. This tool supports traders who require stable chart positioning during timeframe adjustments for short-term analysis.
Gösterge profili

Tartışma

Müşteri değerlendirmeleri

5.0
Değerlendirmeler: 1
5
100 %
4
0 %
3
0 %
2
0 %
1
0 %
Müşteri değerlendirmeleri
September 30, 2025
Very useful and handy tool

SSS

cTrader Store üzerinden erişilebilen işlem botları, göstergeler ve eklentiler gibi ürünler, üçüncü taraf sağlayıcılar tarafından sağlanır ve yalnızca bilgilendirme ve teknik erişim amaçlarıyla sunulur. cTrader Store bir broker değildir ve yatırım tavsiyesi, kişisel öneriler vermez veya gelecekteki performansı garanti etmez.

Bu oluşturanın diğer ürünleri

"IR Candle MTF" logosu
4.6
(6)
Ücretsiz
with this indicator you could see other time frame candle in your chart.
show spread on chart
some user add moving average to macd to see better. in ctrader 4.3.11 there is a problem with this . I make a macd tha
this indicator show macd on chart.
Multi Time Frame Moving Average is a powerful and flexible indicator for cTrader
 this moving include everything that a trader needs from Moving Average.
this indicaotr show distance between Tenkan to Kijun, Close to Kijun and Close to Tenkan 
Add Slowing to IR Moving Average.
IR Candle Open plots customizable opening price lines for daily, weekly, and monthly candles
Coral indicator
you could put your check list in your chart you could split your test with “,” you could put your checklist in indicat
this indicator show other time frame close in lower time frame. for ex: show daily close in m 15.

Şunları da beğenebilirsiniz

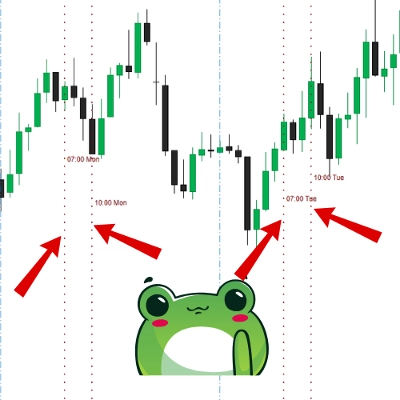
CaptraTimeMarker: Marks key trading hours with lines & labels, plus daily separators for cTrader. Customizable & precise
Explore 88 harmonic price-pattern variants with interactive chart controls and geometric reference levels.
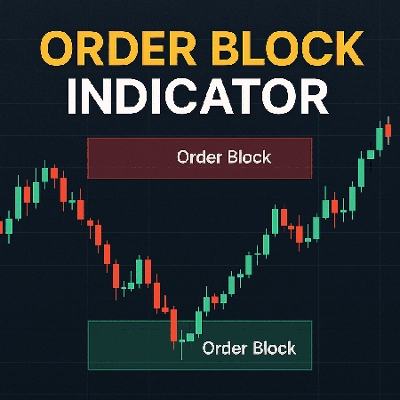
🎯 Order Block Detector - Smart Trading: Identifica bloques de órdenes clave en cTrader para un trading más inteligente.
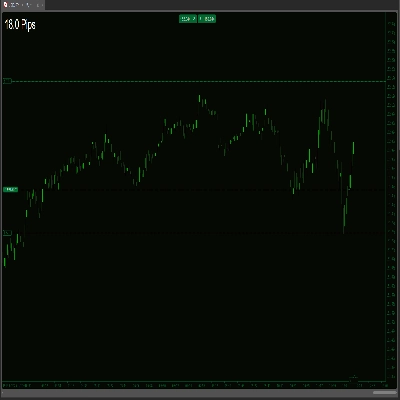
This indicator tracks the unrealised amount of pips in your open positions.
Volume Meter
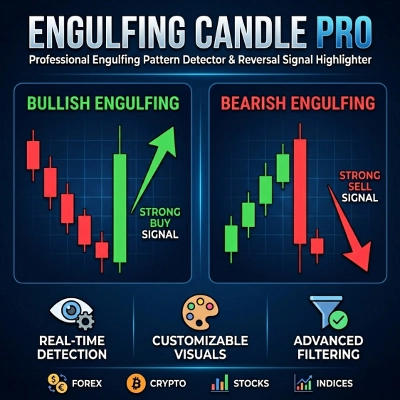
Auto-detects Bullish/Bearish Engulfing patterns to spot trend reversals. Real-time alerts, custom colors, all symbols.
Inside Candle PRO - Professional Inside Bar Pattern Detector
PRO Liquidity Sweep + FVG Combo detector with custom Gold/Blue signals & alerts
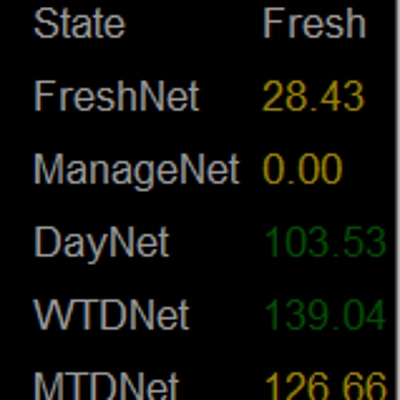
Personal trade tracker for a single symbol. Clear net profit summary — FreshNet, ManageNet, DayNet, WTDNet, MTDNet.
Candle timer with live profit tracking on chart – displays pips, currency value, and percentage in real time.
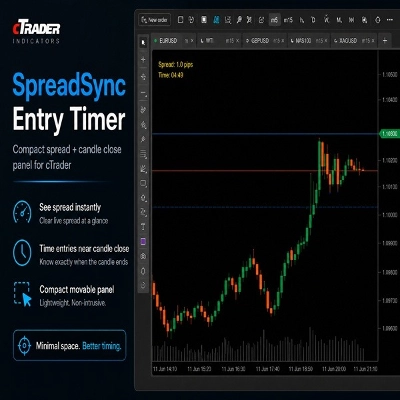
SpreadSync Entry Timer is a compact cTrader indicator that shows live spread and candle-close.
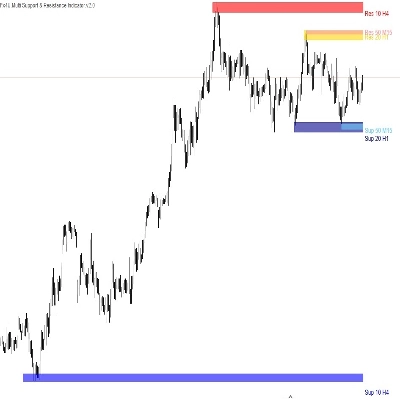
Allow trader to visualize Support & Resistance across different timeframes,give trader an overview of the current market
Nine timeframe cards, vivid candles, native BUY/SELL arrows and adjustable ATR-buffer stop-loss reference lines.
One of the best indicators we have ever developed, with a very high profit ratio.
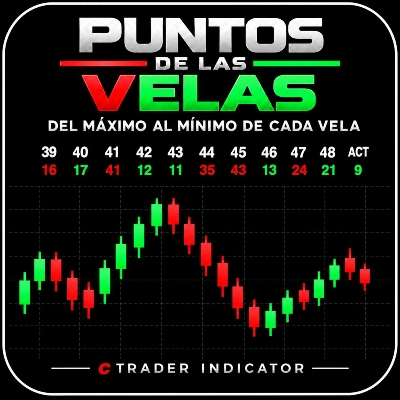
Mide en puntos la distancia entre el Máximo y el Mínimo alcanzados por cada vela, incluida la vela actual.
Multi-timeframe version of the Quantitative Qualitative Estimation (QQE) indicator.
"IVB 2.0" logosu
4.6
(5)
$19
IVB 2.0 is an indicator that works on the strategy of imbalance of the maximum volatility box of indices
a visually very powerful tool for analyzing "opposing forces".

Fiyat

5.64K
Ücretsiz yüklemeler