
คำอธิบาย
Market Regime AI
การตรวจจับสถานะตลาดอัจฉริยะสำหรับการเทรดที่แม่นยำ
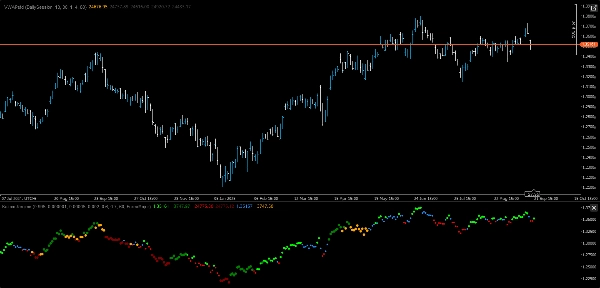
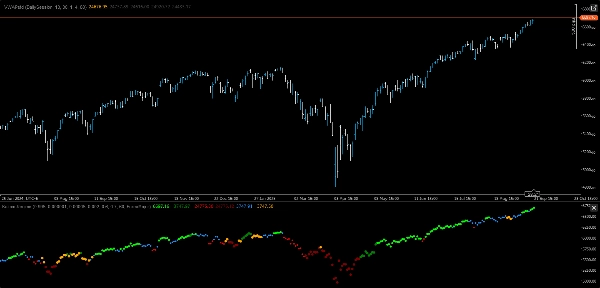
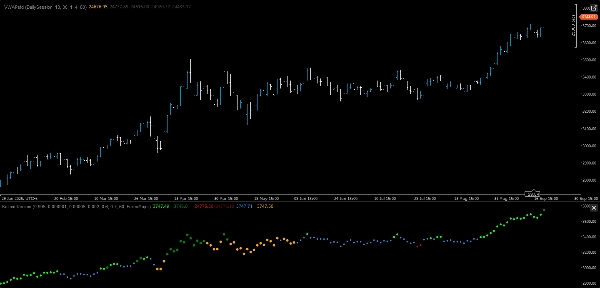
Market Regime AI เป็นตัวบ่งชี้การเทรดล้ำสมัยที่ผสาน AI และคณิตศาสตร์เข้ากับตรรกะปรับตัวเพื่อจำแนกตลาดเป็นหนึ่งในหกสภาวะที่สามารถดำเนินการได้แบบเรียลไทม์ โดยการจำลองทั้งแนวโน้มราคาและความผันผวนพร้อมกัน มันจึงมอบแผนที่ที่ชัดเจนและมีสีสันของ “อารมณ์” ปัจจุบันของตลาด — ช่วยให้นักเทรดเลือกกลยุทธ์ที่เหมาะสมได้ทันที
หกสภาวะ หกสี หนึ่งระบบอัจฉริยะ
สภาวะ สี อารมณ์ตลาด
------------------------ -------------------- -----------------------------------------------
กระทิง – ความผันผวนต่ำ มะนาว แนวโน้มขาขึ้นที่ราบรื่น — เหมาะสำหรับการติดตามแนวโน้มเต็มรูปแบบ
กระทิง – ความผันผวนสูง เขียว แนวโน้มขาขึ้นที่มีความวุ่นวาย — การเทรดเบรกเอาต์ที่มีความเสี่ยงลดลง
หมี – ความผันผวนต่ำ แดง แนวโน้มขาลงที่ควบคุมได้ — โอกาสติดตามแนวโน้มแบบสั้น
หมี – ความผันผวนสูง มารูน การลดลงอย่างรวดเร็ว — การชอร์ตแบบรุนแรงหรือการป้องกันความเสี่ยง
ด้านข้าง – ความผันผวนต่ำ ดอดเจอร์บลู การรวมตัวอย่างเงียบสงบ — การตั้งค่าการกลับสู่ค่าเฉลี่ย
ด้านข้าง – ความผันผวนสูง ส้ม ช่วงที่ผันผวน — หลีกเลี่ยงหรือเทรดสั้นด้วยการหยุดที่แน่น
คุณสมบัติหลัก
• การจำลอง AI สองสถานะ: ติดตามทั้งแนวโน้มและความผันผวนเพื่อสัญญาณที่ลึกซึ้งและน่าเชื่อถือมากขึ้น
• การตั้งค่าล่วงหน้าที่รู้จักสินทรัพย์: การตั้งค่าที่เหมาะสมสำหรับ Forex หลัก, สกุลเงินแปลกใหม่, ทองคำ และดัชนี — สลับได้ทันทีผ่านเมนูแบบเลื่อนลง
• ความชัดเจนทางสายตา: จุดสภาวะและการไล่ระดับสีพื้นหลังที่เลือกได้ทำให้สถานะตลาดชัดเจนในพริบตา
• การทำแผนที่เชิงกลยุทธ์: เชื่อมโยงแต่ละสภาวะกับสไตล์การเทรด ขนาดตำแหน่ง และการควบคุมความเสี่ยง
• การลดเสียงรบกวน: ทำให้ข้อมูลตลาดเรียบเนียนเพื่อเผยสถานะที่แท้จริง หลีกเลี่ยงสัญญาณเท็จ
ทำไมมันถึงไม่เหมือนใคร
ตัวบ่งชี้ส่วนใหญ่เน้นที่มิติเดียว — แนวโน้มหรือความผันผวน Market Regime AI ผสานทั้งสองเข้าด้วยกันในโมเดลปรับตัวแบบรวม ทำให้นักเทรดได้รับมุมมองหลายชั้นของสภาพตลาด ซึ่งหมายถึงการตัดสินใจและกลยุทธ์ที่รวดเร็วและชาญฉลาดขึ้นที่ปรับตัวตามการเปลี่ยนแปลงของตลาด
สถานการณ์การใช้งาน
• การติดตามแนวโน้ม: เข้าร่วมในสภาวะ Bull/Bear–LowVol ด้วยขนาดเต็ม
• การเทรดเบรกเอาต์: มุ่งเป้าไปที่สภาวะ Bull/Bear–HighVol สำหรับการเคลื่อนไหวที่รุนแรง
• การกลับสู่ค่าเฉลี่ย: ใช้ประโยชน์จากช่วง Sideways–LowVol
• การปรับขนาดความเสี่ยง: ลดการเปิดรับในสภาวะ HighVol เพื่อปกป้องทุน
• การสลับกลยุทธ์อัตโนมัติ: ป้อนผลลัพธ์สภาวะเข้าสู่ cBots สำหรับการเทรดแบบไม่ต้องใช้มือ
สรุป
รีวิวจากลูกค้า
5 | 100 % | |
4 | 0 % | |
3 | 0 % | |
2 | 0 % | |
1 | 0 % |


