
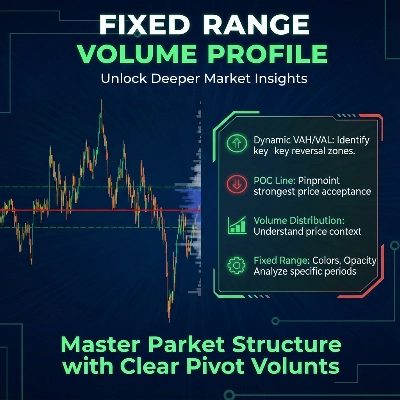
Fixed Range Volume Profile
อินดิเคเตอร์
5 การซื้อ
เวอร์ชัน 1.0, Jan 2026
Windows, Mac
4.0
รีวิว: 2

ตั้งแต่ 26/09/2025
18
การขาย
คำอธิบาย
วิธีใช้ Fixed Range Volume Profile (FRVP)
- เปิดใช้งานตัวบ่งชี้: ลากและวาง FRVP Indicator ลงบนกราฟที่คุณต้องการจากเมนู cTrader Automate หรือ Indicators
- เลือกเครื่องมือวิเคราะห์: ค้นหาเครื่องมือวาดรูปสี่เหลี่ยมมาตรฐาน Rectangle Drawing Tool ในแถบเครื่องมือ cTrader (โดยปกติจะอยู่ด้านขวาหรือซ้ายของแพลตฟอร์ม)
- กำหนดช่วงของคุณ: คลิกและลากสี่เหลี่ยมไปยังช่วงราคาที่ต้องการวิเคราะห์และช่วงเวลาที่ต้องการ
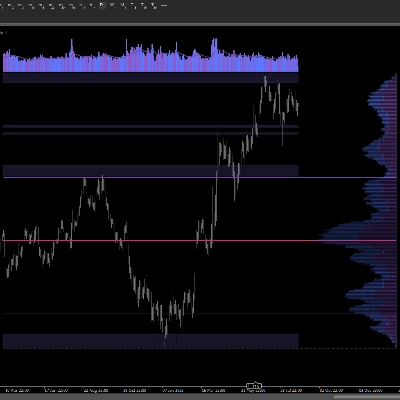
- เริ่มต้นโปรไฟล์: หลังจากวาดเสร็จแล้ว คลิกและขยับ สี่เหลี่ยมเล็กน้อย การ "จับมือ" ระหว่างการวาดและตัวบ่งชี้นี้จะกระตุ้นการคำนวณปริมาณทันที สร้างฮิสโตแกรม, POC และเส้น Value Area
- ปรับเปลี่ยนแบบไดนามิก: คุณสามารถลากขอบของสี่เหลี่ยมเพื่อขยายช่วงเวลา หรือย้ายไปยังช่วงราคาที่ต่างออกไป; โปรไฟล์ปริมาณจะคำนวณใหม่โดยอัตโนมัติเพื่อสะท้อนพื้นที่ใหม่
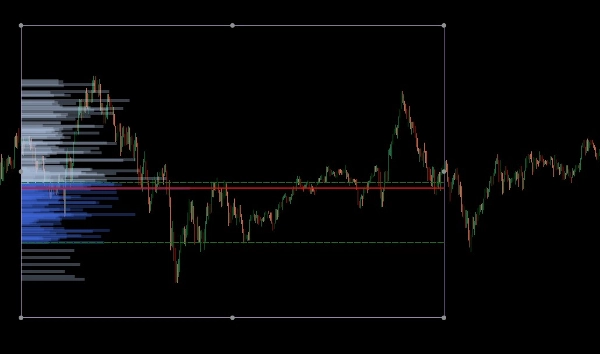
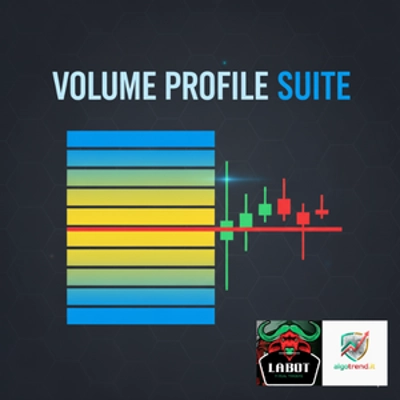
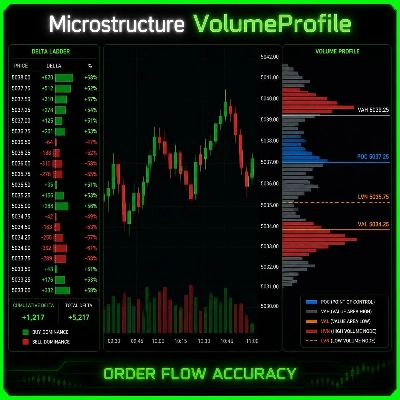
Fixed Range Volume Profile (FRVP) สำหรับ cTrader เป็นเครื่องมือวิเคราะห์ขั้นสูงที่ออกแบบมาเพื่อระบุระดับราคาสำคัญโดยการคำนวณการกระจายปริมาณในช่วงเวลาหนึ่งและช่วงราคาที่กำหนด แตกต่างจากตัวบ่งชี้ปริมาณมาตรฐานที่สัมพันธ์กับเวลา ตัวบ่งชี้นี้เน้นที่ความหนาแน่นของราคาเพื่อเปิดเผยความรู้สึกตลาด
คุณสมบัติหลัก
- การเลือกช่วงแบบไดนามิก: ตัวบ่งชี้จะคำนวณและอัปเดตโดยอัตโนมัติทุกครั้งที่คุณวาดหรือย้ายสี่เหลี่ยมมาตรฐานบนกราฟ cTrader ของคุณ
- การระบุระดับสำคัญ:
-
- Point of Control (POC): เน้นระดับราคาที่มีปริมาณการซื้อขายสูงสุด ทำหน้าที่เหมือน "แม่เหล็ก" สำหรับการเคลื่อนไหวของราคา
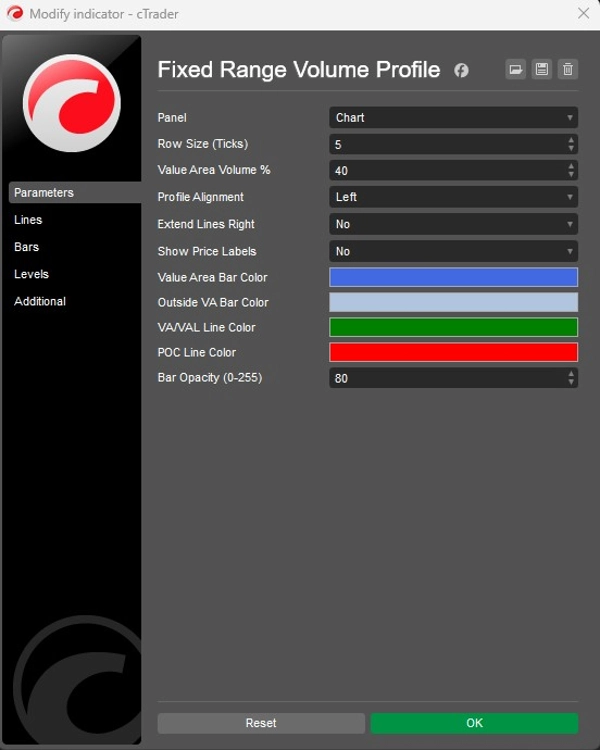
- Value Area High/Low (VAH/VAL): กำหนดขอบเขตที่มีการซื้อขายปริมาณตามเปอร์เซ็นต์ที่กำหนด (ค่าเริ่มต้น 40%)
- รูปแบบที่ปรับแต่งได้:
-
- การจัดตำแหน่ง: เลือกแสดงฮิสโตแกรมปริมาณจาก ด้านซ้าย หรือ ด้านขวา ของกล่อง
- ความละเอียด: ปรับ ขนาดแถว (ค่าเริ่มต้น 5 ticks) เพื่อควบคุมรายละเอียดของแท่งปริมาณ
- ภาพประกอบ: ควบคุมสีของแท่ง (Value Area กับ ภายนอก), ความทึบแสง และการแสดงป้ายราคาทั้งหมด
การประยุกต์ใช้เชิงกลยุทธ์
- แนวรับและแนวต้าน: High Volume Nodes (HVN) มักทำหน้าที่เป็นแนวรับหรือแนวต้านที่แข็งแกร่ง ในขณะที่ Low Volume Nodes (LVN) แสดงถึงพื้นที่ "บาง" ที่ราคาสามารถเคลื่อนไหวได้อย่างรวดเร็ว
- การยืนยันแนวโน้ม: ใช้ฟีเจอร์ Extend Right เพื่อดูว่าระดับปริมาณในอดีตมีปฏิสัมพันธ์กับการเคลื่อนไหวราคาปัจจุบันอย่างไรในขณะที่มันพัฒนา
สรุป
สรุปโดย AI
The Fixed Range Volume Profile (FRVP) indicator for cTrader analyzes volume distribution within a user-defined price and time range using a standard rectangle drawing tool. By selecting and adjusting this rectangle on the chart, the indicator dynamically calculates and displays a volume histogram along with key levels: Point of Control (POC), which marks the price with the highest traded volume, and Value Area High/Low (VAH/VAL), defining the volume concentration boundaries. Users can customize the histogram’s alignment, granularity (row size), colors, opacity, and price label visibility. The indicator supports dynamic range adjustments by dragging the rectangle edges, automatically recalculating volume data. Strategically, it helps identify support and resistance zones through high and low volume nodes and offers trend confirmation by extending volume levels into current price action. The FRVP is applicable across various markets including Forex, cryptocurrencies, commodities, indices, and stocks, and supports symbols such as BTCUSD, EURUSD, GBPUSD, XAUUSD, and NAS100. It integrates with cTrader’s drawing tools and provides a detailed volume-based perspective on price action beyond standard time-based volume indicators.
โปรไฟล์อินดิเคเตอร์
หมวดหมู่อินดิเคเตอร์
ปริมาณ
ประเภทเอาต์พุต
การแสดงเป็นภาพ
ข้อกำหนดด้านข้อมูล
แท่งเท่านั้น
ปริมาณ
การสนทนา
รีวิวจากลูกค้า
4.0
รีวิว: 2
5 | 0 % | |
4 | 100 % | |
3 | 0 % | |
2 | 0 % | |
1 | 0 % |
คำถามที่พบบ่อย
Forex
Signal
Scalping
Indices
Commodities
Crypto
Stocks
ผลิตภัณฑ์ที่มีให้บริการผ่าน cTrader Store รวมถึงบอทการเทรด อินดิเคเตอร์ และปลั๊กอิน มีให้บริการโดยนักพัฒนาบุคคลที่สามและมีไว้เพื่อวัตถุประสงค์ในการเข้าถึงข้อมูลและทางเทคนิคเท่านั้น cTrader Store ไม่ใช่โบรกเกอร์และไม่ได้ให้คำแนะนำการลงทุน คำแนะนำส่วนบุคคล หรือการรับประกันผลการดำเนินงานในอนาคต











ราคา
ตั้งแต่ 26/09/2025
18
การขาย