คำอธิบาย
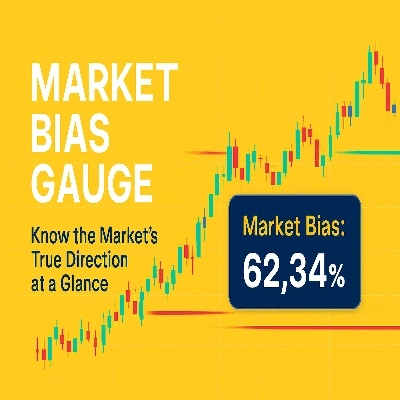
ตัวชี้วัดมาตรวัดแนวโน้มตลาด
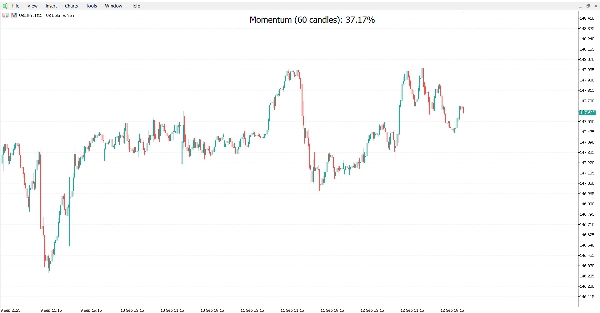
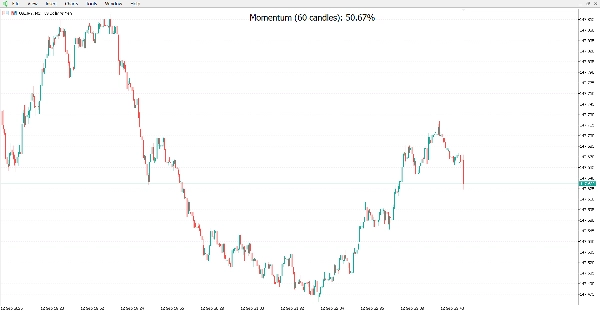
มาตรวัดแนวโน้มตลาดเป็นเครื่องมือวิเคราะห์ทางเทคนิคที่ออกแบบมาเพื่อให้เทรดเดอร์ได้รับภาพรวมของโมเมนตัมตลาดอย่างรวดเร็วและชัดเจนโดยตรงบนกราฟของพวกเขา แทนที่จะเป็นการตั้งค่าที่ซับซ้อนหรือเครื่องมือชี้วัดที่รก เครื่องมือนี้ให้ค่าตัวชี้วัดเดียวที่ทรงพลัง: เปอร์เซ็นต์ของการเคลื่อนไหวแบบกระทิงเทียบกับแบบหมีในช่วงเวลาที่คุณเลือก
วัตถุประสงค์ของเครื่องมือ:
เครื่องมือนี้มีเป้าหมายเพื่อช่วยให้คุณประเมินได้ทันทีว่าผู้ซื้อหรือผู้ขายกำลังควบคุมตลาด ซึ่งจะช่วยให้คุณตัดสินใจเทรดได้เร็วขึ้นและมั่นใจมากขึ้น
วิธีอ่านเปอร์เซ็นต์โมเมนตัม:
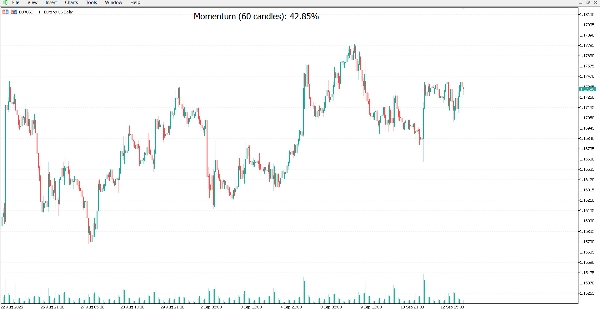
ต่ำกว่า 50%: บ่งชี้ว่าโมเมนตัมแบบหมีมีอำนาจเหนือกว่า ผู้ขายแข็งแกร่งกว่าผู้ซื้อในช่วงเวลาที่เลือก และแนวโน้มตลาดเป็นขาลง
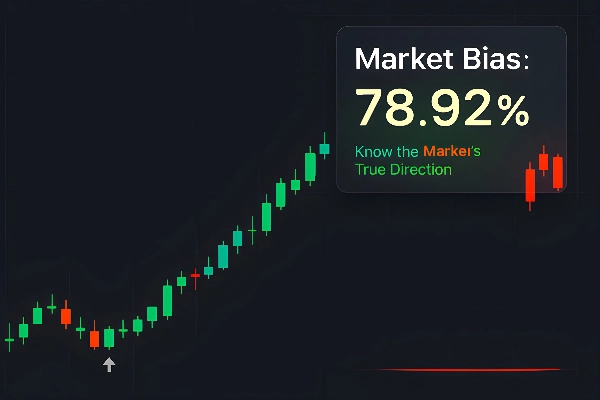
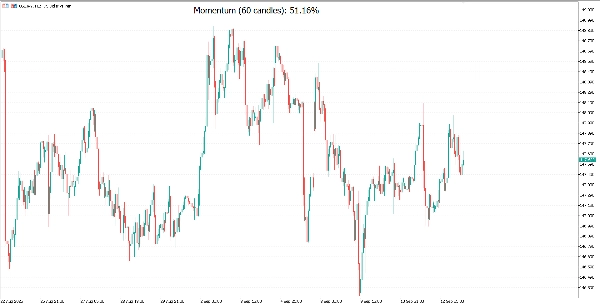
สูงกว่า 50%: บ่งชี้ว่าโมเมนตัมแบบกระทิงมีอำนาจเหนือกว่า ผู้ซื้อแข็งแกร่งกว่าผู้ขายในช่วงเวลาที่เลือก และแนวโน้มตลาดเป็นขาขึ้น
เท่ากับ 50%: บ่งชี้ว่าตลาดมีความสมดุล ไม่มีแนวโน้มที่ชัดเจน
คุณสมบัติ:
การอ่านโมเมนตัมทันที: คำนวณเปอร์เซ็นต์ของการเปลี่ยนแปลงราคาขาขึ้นเทียบกับขาลงในแท่งเทียนล่าสุด (ค่าเริ่มต้น: 60)
การแสดงผลบนกราฟที่ชัดเจน: แสดงค่ามอเมนตัมด้วยตัวอักษรขนาดใหญ่และอ่านง่าย ตรงกลางกราฟของคุณอย่างสมบูรณ์แบบ
รูปลักษณ์ที่ปรับแต่งได้เต็มที่: เลือกแบบอักษร ขนาด และสีที่คุณชอบให้เหมาะกับสไตล์การเทรดของคุณ
การตรวจจับตลาดที่เป็นกลาง: แสดงค่าการอ่าน 50% ที่สมดุลเมื่อไม่มีการเคลื่อนไหวสุทธิในตลาด
น้ำหนักเบาและรวดเร็ว: ทำงานได้อย่างราบรื่นบนกราฟใด ๆ แม้จะมีชุดข้อมูลขนาดใหญ่หรือการเทรดสด
อัปเดนไดนามิก: รีเฟรชโดยอัตโนมัติทุกแท่งเทียนใหม่ ทำให้คุณสอดคล้องกับตลาด
ทำไมเทรดเดอร์ถึงชอบมัน:
ไม่มีการเดา: เห็นแนวโน้มตลาดได้ในพริบตาเดียว
จังหวะเวลาที่ดีกว่า: สังเกตการเปลี่ยนแปลงของโมเมนตัมก่อนที่จะปรากฏบนตัวชี้วัดแบบดั้งเดิม
เพื่อนร่วมทางที่สมบูรณ์แบบ: ทำงานควบคู่กับกลยุทธ์ที่มีอยู่ของคุณโดยไม่เพิ่มความรกบนกราฟ
ข้อจำกัดความรับผิดชอบ
มาตรวัดแนวโน้มตลาดเป็นเครื่องมือวิเคราะห์ทางเทคนิคที่มีวัตถุประสงค์เพื่อข้อมูลและการวิเคราะห์เท่านั้น เครื่องมือนี้ไม่ได้ให้คำแนะนำทางการเงินหรือการลงทุนและไม่รับประกันผลกำไร การเทรดในตลาดการเงินมีความเสี่ยงสูงและอาจทำให้คุณสูญเสียเงินทุน คุณเป็นผู้รับผิดชอบแต่เพียงผู้เดียวต่อการตัดสินใจลงทุนของคุณ คุณควรใช้เครื่องมือนี้เป็นส่วนหนึ่งของกลยุทธ์การเทรดที่ครอบคลุมซึ่งรวมถึงการบริหารความเสี่ยง
สรุป
รีวิวจากลูกค้า
5 | 0 % | |
4 | 100 % | |
3 | 0 % | |
2 | 0 % | |
1 | 0 % |


!["[Stellar Strategies] MARSI Signal Plotter" โลโก้](https://cdn.ctrader.com/image/webp/7b2b8da6-8f8e-4646-8d4a-4710c516c01e_25567)

