
TrendStrengthSignals
อินดิเคเตอร์
เวอร์ชัน 1.0, Aug 2025
Windows, Mac
5.0
รีวิว: 1
คำอธิบาย
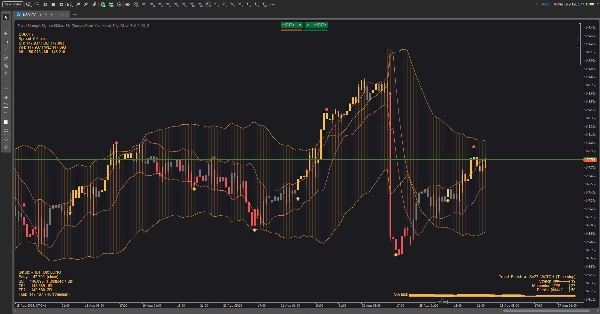
ชุดเครื่องมือภาพสำหรับการเทรดตามแนวโน้มที่ผสมผสานซองความผันผวนกับช่องที่รับรู้รอบเวลาเพื่อแสดงสภาพแวดล้อม เวลา และความเสี่ยงในพริบตา ออกแบบมาให้สามารถอ่านได้บนพื้นหลังใดก็ได้ (สว่าง/มืด) และเพื่อให้หน้าจอสะอาดในขณะที่ยังให้คำใบ้ “ต้องทำอะไรต่อไป” กับคุณ
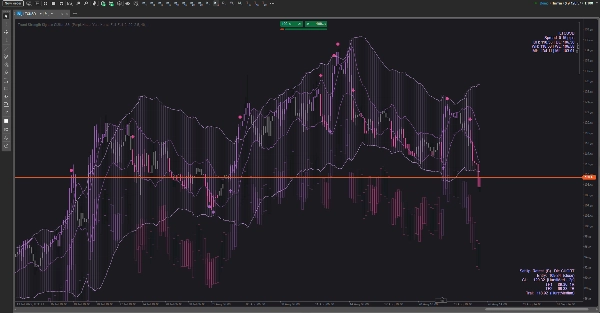
สิ่งที่คุณเห็นบนกราฟ
- เมฆ (สลับเปิด/ปิดได้):
-
- เมฆ ความผันผวน ที่ขยาย/หดตัวตามกิจกรรมตลาด
- เมฆ รอบเวลา ที่ติดตามจังหวะหมุนเวียนของราคา
- คุณสามารถแสดงอย่างใดอย่างหนึ่ง ทั้งสองอย่าง หรือไม่แสดงเลยก็ได้
- สัญญาณ: ลูกศรขึ้น/ลงที่ไม่รบกวนสำหรับการเปลี่ยนแนวโน้มที่เป็นไปได้; จุดเล็กๆ สำหรับการกระตุ้นการทำกำไร
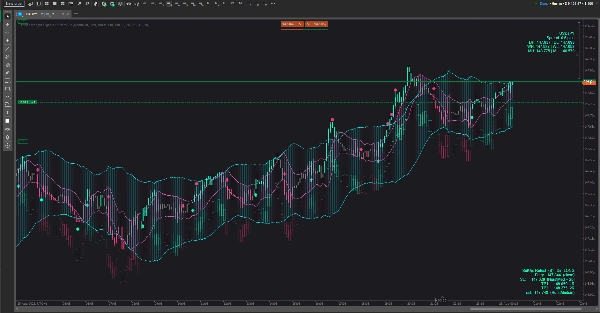
- หน้าจอแสดงความแข็งแกร่งของแนวโน้ม (สามสไตล์):
-
- แบบเบา — แท็กสถานะขนาดกะทัดรัด
- โปร — แดชบอร์ดขนาดเล็กที่มีมาตรวัดสามตัว (การยืด การเคลื่อนไหว ความต่อเนื่อง) พร้อมเส้นกราฟประวัติขนาดเล็ก
- ริบบิ้น — แถบอ่อนใกล้ราคาที่ความเข้มตามความแข็งแกร่งของแนวโน้ม
- หน้าจอแสดงความเสี่ยง: เสนอทิศทาง พื้นที่หยุดป้องกัน เป้าหมายกำไรสองชั้น และแนวคิดการติดตามที่เลือกได้ ตั้งอยู่ในมุมใดก็ได้ที่คุณเลือกและอัปเดตตามการเปลี่ยนแปลงของแท่ง
- หน้าจอตลาด: สัญลักษณ์ & สเปรด พร้อมข้อมูลอ้างอิงสูง–ต่ำรายวัน/สัปดาห์/เดือน เพื่อให้คุณรู้ตำแหน่งของคุณในแผนที่ใหญ่เสมอ
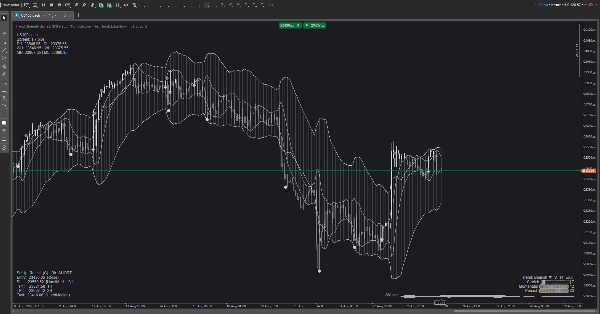
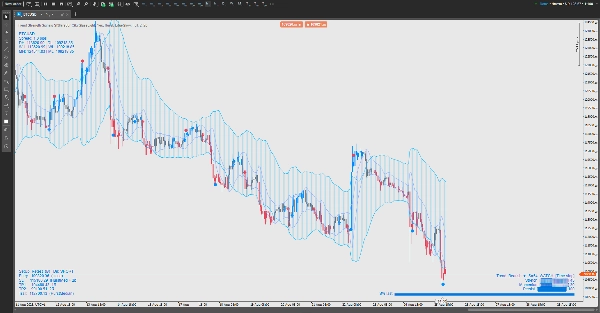
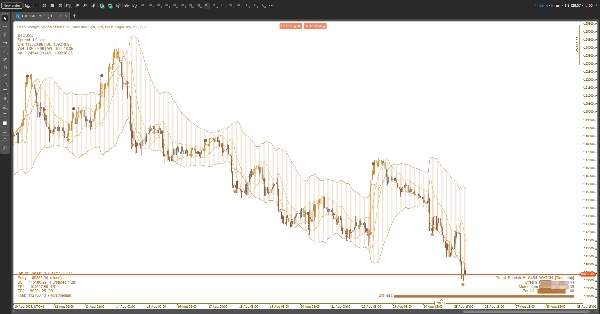
- ธีม: ชุดสีที่คัดสรรสำหรับกราฟสว่างและมืด (และโหมดกำหนดเอง) องค์ประกอบกราฟิกทั้งหมด—รวมถึงหน้าจอและสัญญาณ—จะตามธีมที่ใช้งานอยู่
วิธีใช้ (เชิงปฏิบัติ ไม่ใช่เชิงเทคนิค)
- เลือกมุมมองเมฆของคุณ:
-
- ใช้เมฆ ความผันผวน เพื่อดูการบีบและการขยายตัว
- ใช้เมฆ รอบเวลา เพื่อประเมินการหมุน “ขอบ” กับ “กลาง”
- ใช้ทั้งสองอย่างถ้าคุณต้องการบริบท + เวลา
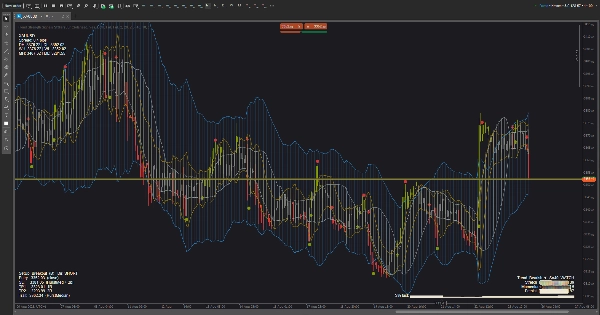
- อ่านความแข็งแกร่งของแนวโน้ม:
-
- เมื่อสถานะเพิ่มขึ้นเป็น HOLD ให้เทรดตามทิศทางปัจจุบัน; เมื่อสถานะลดลงเป็น WATCH ให้ลดความก้าวร้าว; ถ้าแสดง EXIT หลีกเลี่ยงการเทรดใหม่หรือเพิ่มความระมัดระวังความเสี่ยง
- ในโหมด โปร มาตรวัดที่เพิ่มขึ้น + เส้นกราฟที่เพิ่มขึ้น = คุณภาพที่ดีขึ้น; มาตรวัดที่ลดลง = จัดการความเสี่ยงให้ลดลง
- กำหนดเวลาการเข้าเทรดกับราคากับเมฆ:
-
- การเบรกเอาต์หลังการบีบ การเข้าใหม่หลังการดึงกลับอย่างสุภาพไปยังเมฆ หรือการดีดตัวจากขอบนอกเป็นรูปแบบหลัก
- ถ้าลูกศรปรากฏขึ้นกลางแท่งก่อนแล้วหายไป ให้รอยืนยันการปิดแท่งถ้าคุณต้องการหลีกเลี่ยงสัญญาณหลอก
- จัดการการเทรดด้วยหน้าจอแสดงความเสี่ยง:
-
- วางจุดหยุดป้องกันประมาณเลยขอบเขตโครงสร้างที่ใกล้ที่สุดที่หน้าจอแสดงความเสี่ยงเน้น
- ทยอยออกที่ TP1 ปล่อยส่วนที่เหลือไปที่ TP2 หรือทำตามเส้นติดตามที่แนะนำ
- ถ้าความแข็งแกร่งของแนวโน้มลดลงจากแข็งแรงเป็นอ่อน ให้พิจารณาออกก่อน
- ตัวกรองตามสถานการณ์:
-
- หลีกเลี่ยงการเข้าเทรดเมื่อเมฆบางและสับสน หรือเมื่อสถานะความแข็งแกร่งอยู่ใน EXIT
- ชอบเทรดเมื่อความแข็งแกร่งกำลังเพิ่มขึ้น เมฆเอียง และราคามีปฏิสัมพันธ์กับขอบอย่างชัดเจน
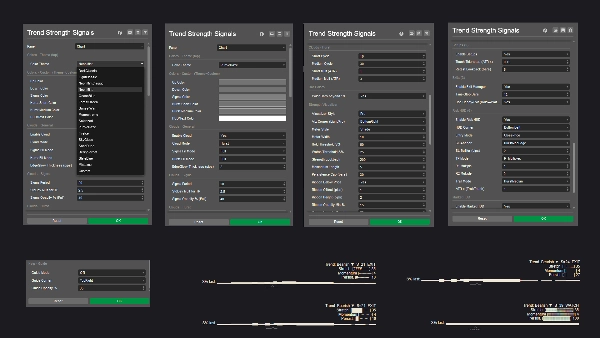
การปรับแต่ง
- สลับมุมหน้าจอแสดงผล สไตล์การแสดงผล และธีมสีให้ตรงกับพื้นที่ทำงานของคุณ
- ธีมที่เหมาะกับแสงช่วยให้ข้อความมองเห็นได้บนพื้นหลังสีขาว; พาเลตต์ทะเล/ป่า/พระอาทิตย์ตกเพิ่มความเปรียบต่างอย่างละเอียดโดยไม่แสบตา
สิ่งที่มัน ไม่ใช่
นี่ไม่ใช่โปรแกรมเทรดอัตโนมัติแบบกล่องดำ มันเป็นเครื่องมือช่วยตัดสินใจ: มันกรอบคุณภาพแนวโน้ม เสนอจุดเสี่ยงที่สมเหตุสมผล และเน้นช่วงเวลาที่มีความน่าจะเป็นสูง—แต่คุณยังคงควบคุมเอง
สรุป
โปรไฟล์อินดิเคเตอร์
รีวิวจากลูกค้า
5.0
รีวิว: 1
5 | 100 % | |
4 | 0 % | |
3 | 0 % | |
2 | 0 % | |
1 | 0 % |
รีวิวจากลูกค้า
September 2, 2025
The reason it feels usable is direction is easier to respect, and a 1R exit plan makes review easier.
การสนทนา
คำถามที่พบบ่อย
ผลิตภัณฑ์ที่มีให้บริการผ่าน cTrader Store รวมถึงบอทการเทรด อินดิเคเตอร์ และปลั๊กอิน มีให้บริการโดยนักพัฒนาบุคคลที่สามและมีไว้เพื่อวัตถุประสงค์ในการเข้าถึงข้อมูลและทางเทคนิคเท่านั้น cTrader Store ไม่ใช่โบรกเกอร์และไม่ได้ให้คำแนะนำการลงทุน คำแนะนำส่วนบุคคล หรือการรับประกันผลการดำเนินงานในอนาคต


ราคา
ตั้งแต่ 26/05/2025
385.09M
ปริมาณการเทรด
60.66K
Pips ที่ได้กำไร
14
การขาย
1.4K
ติดตั้งฟรี