
คำอธิบาย
QX Candle Pressure Index คือ อินดิเคเตอร์แรงกดของแท่งเทียนสำหรับ cTrader ที่ช่วยให้นักเทรดอ่านได้ว่าแต่ละแท่งเทียนปิดอย่างแข็งแกร่งแค่ไหนภายในช่วงของมันเอง
แทนที่จะใช้หน้าต่างออสซิลเลเตอร์แยกต่างหาก CPI จะแสดงแรงกดโดยตรงบนกราฟหลักผ่านเครื่องหมายจุดกึ่งกลางที่กะทัดรัด ซึ่งทำให้ง่ายขึ้นในการอ่าน ความแข็งแกร่งของการปิด, แนวโน้มขาขึ้นหรือลง, และโมเมนตัมระยะสั้นโดยมีเสียงรบกวนน้อยลง
การใช้งานหลัก
CPI ถูกออกแบบมาเพื่อช่วยนักเทรด:
- ประเมินคุณภาพการปิดแท่งเทียน
- ยืนยันแรงกดทิศทาง
- ประเมินความแข็งแกร่งของการเบรคเอาท์
- อ่านการดึงกลับได้ชัดเจนขึ้น
- สังเกตการเปลี่ยนแปลงโมเมนตัมได้เร็วขึ้น
วิธีการทำงาน
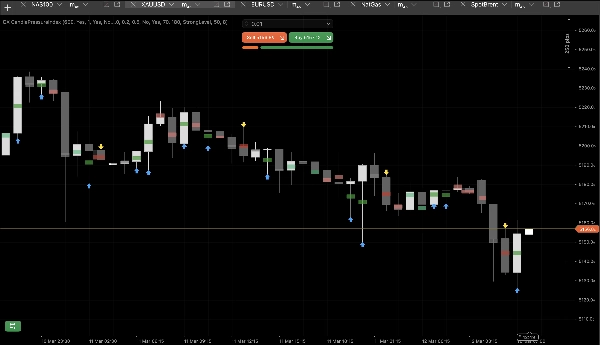
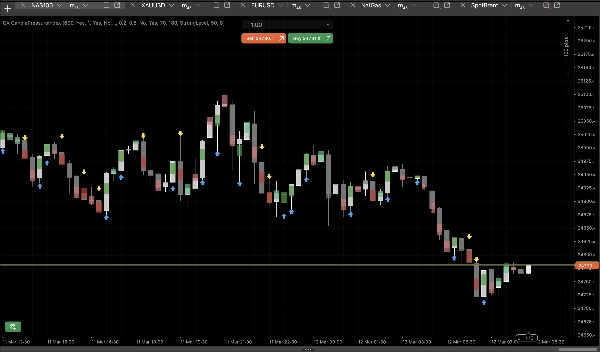
แต่ละแท่งเทียนจะถูกจัดประเภทตามตำแหน่งที่มันปิดภายในช่วงของตัวเอง:
- ใกล้จุดสูงสุด = แรงกดขาขึ้น
- ใกล้จุดต่ำสุด = แรงกดขาลง
- ใกล้จุดกึ่งกลาง = แรงกดเป็นกลาง
ข้อมูลนี้จะแสดงโดยใช้:
- เครื่องหมายแรงกดจุดกึ่งกลาง
- 5 โซนแรงกด
- ลูกศรตัวเลือกสำหรับแรงกดที่แข็งแกร่ง
- เลเยอร์ตัวเลือกบนตัวแท่งเทียน
โซนแรงกด
CPI แยกแท่งเทียนออกเป็น 5 สถานะภาพ:
- ซื้อแรง
- ซื้ออ่อน
- เป็นกลาง
- ขายอ่อน
- ขายแรง
สิ่งนี้ช่วยให้นักเทรดระบุได้ว่าการเคลื่อนไหวแข็งแกร่ง อ่อนแอ หรือสมดุล
คุณสมบัติหลัก
เครื่องหมายแรงกดจุดกึ่งกลาง
เครื่องหมายภาพที่กะทัดรัดยึดติดที่จุดกึ่งกลางของแท่งเทียน
5 โซนแรงกด
แยกชัดเจนระหว่างการปิดที่แข็งแกร่ง อ่อน และเป็นกลาง
ข้ามแท่งที่กำลังสร้าง
ไม่สนใจแท่งเทียนสดจนกว่าจะปิดเพื่อการอ่านที่เสถียรมากขึ้น
ซ่อนเครื่องหมายเป็นกลาง
ทำให้กราฟสะอาดขึ้นโดยแสดงเฉพาะแท่งเทียนที่มีทิศทาง
โหมดลูกศร
เน้นแท่งเทียนขาขึ้นหรือขาลงที่แข็งแกร่งอย่างชัดเจนด้วยภาพ
เลเยอร์ตัวแท่งเทียน
เพิ่มเลเยอร์เสริมที่ละเอียดอ่อนเพื่อให้อ่านกราฟได้ง่ายขึ้น
พารามิเตอร์หลักและวิธีใช้งาน
จำนวนแท่งย้อนหลัง
ควบคุมจำนวนแท่งเทียนในอดีตที่จะแสดง
ข้ามแท่งที่กำลังสร้าง
เปิดใช้งานเพื่ออ่านแท่งที่ปิดแล้วและสัญญาณที่เสถียรมากขึ้น
เกณฑ์อ่อน
กำหนดว่าเมื่อใดแท่งเทียนจะหยุดเป็นกลาง
เกณฑ์แข็ง
กำหนดว่าเมื่อใดแรงกดจะกลายเป็นแรง
ซ่อนเครื่องหมายเป็นกลาง
ใช้เพื่อมุมมองทิศทางที่สะอาดขึ้น
โหมดลูกศร
เลือกได้ระหว่างไม่มีลูกศร, ลูกศรบนแท่งเทียนแรงทุกแท่ง, หรือเฉพาะลูกศรบนการเปลี่ยนแปลงแรงเท่านั้น
สเกล / ความกว้าง / ความทึบของเครื่องหมาย
ปรับลักษณะภาพให้เหมาะกับสไตล์กราฟของคุณ
เหมาะสำหรับ
- ยืนยันการต่อเนื่องของแนวโน้ม
- ประเมินคุณภาพการเบรคเอาท์
- วิเคราะห์การดึงกลับ
- อ่านโมเมนตัมระยะสั้น
- ตีความการเคลื่อนไหวราคาที่สะอาดขึ้น
สรุป
QX Candle Pressure Index เป็นเครื่องมือภาพที่สะอาดสำหรับนักเทรดที่ต้องการอ่านแรงกดของแท่งเทียนโดยตรงบนกราฟ โดยไม่ต้องเพิ่มหน้าต่างอินดิเคเตอร์อื่น
สรุป
รีวิวจากลูกค้า
5 | 50 % | |
4 | 50 % | |
3 | 0 % | |
2 | 0 % | |
1 | 0 % |


