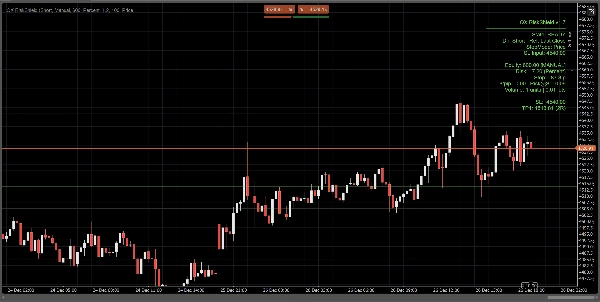
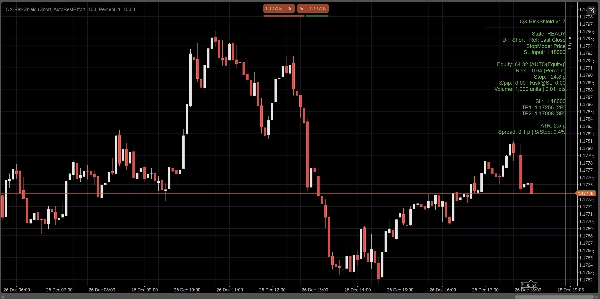
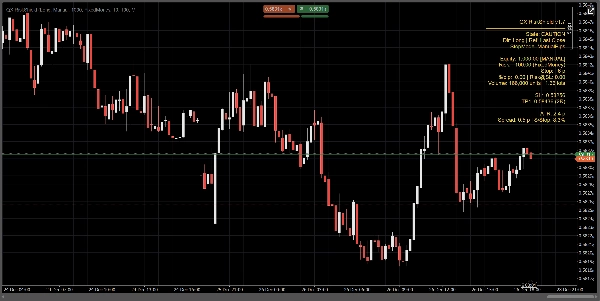
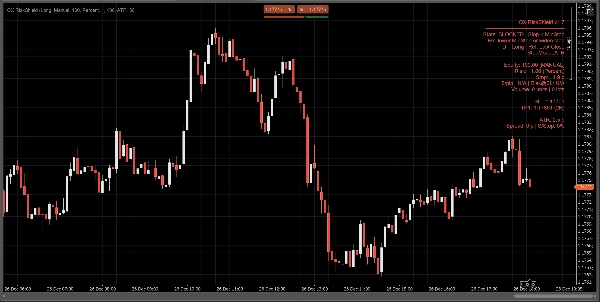
"QX RiskShield" โลโก้
QX RiskShield
"QX RiskShield" ภาพที่อัปโหลด
34.45M
ปริมาณการเทรด
194.05K
Pips ที่ได้กำไร
9
การขาย
213
ติดตั้งฟรี

QX RiskShield is an on-chart risk calculator that converts your stop distance into exact position size (Units and Lots), plus SL/TP price levels based on your R:R targets. It is designed for fast decision-making with minimal chart clutter.


This is an indicator only. It does not place orders.


What you see:

A compact panel shows, at a glance:

  • State: READY / CAUTION / BLOCKED
  • Equity source: Manual or Auto (best effort, fallback-safe)
  • Risk amount: % of equity or fixed money risk
  • Stop distance: in pips
  • Position size: Units + Lots (normalized to broker constraints)
  • $/pip and Risk@SL (estimated risk at the stop)
  • SL / TP1 / TP2 price levels (based on your RR targets)
  • Optional Entry / SL / TP lines on chart for visual reference

All calculations are based on the Last Close (stable, no intrabar flicker).


Stop modes:

Choose how your stop is defined:

1) Manual Pips

Set a fixed stop distance in pips.


2) ATR Stop

Stop distance = ATR(pips) × ATR k.

Useful for volatility-adaptive sizing across symbols.


3) Price Stop

Set the exact SL price (best for discretionary trading).

RiskShield converts that price distance into pips and sizes position accordingly.


State logic (no confusion):

RiskShield uses clear states so users immediately understand what is happening:


READY

Inputs are valid. Position sizing is available.


CAUTION

Sizing is valid, but RiskShield detected a tight stop vs ATR.

This is a warning, not a block.


BLOCKED

Sizing is intentionally disabled when rules are unsafe or invalid, such as:

  • Stop below the minimum stop threshold
  • SL price on the wrong side of the reference price
  • Spread too high relative to stop (Spread/Stop %)
  • Volume would be below broker minimum
  • Symbol pip/lot data not available

A short “Fix” hint can be shown (optional) to correct inputs quickly.


How traders use QX RiskShield (simple workflow)

  1. Attach QX RiskShield to your chart.
  2. Select Trade Direction (Long or Short).
  3. Choose your Risk Type:
    • Percent of equity, or
    • Fixed money risk per trade
  4. Choose Stop Mode:
    • Manual pips, ATR, or SL Price
  5. Read the output:
    • Use Units/Lots for your order size
    • Use SL/TP levels as your reference prices
  6. If the panel shows CAUTION, consider widening the stop or using ATR mode.
  7. If the panel shows BLOCKED, adjust the inputs until READY.


UI options (built for clean charts):

  • Panel Mode: Simple or Pro
  • Panel Density: Normal or Compact (for minimal text)
  • Show Suggested Fix: On/Off
  • Show Lines: On/Off
  • Show Entry Line: On/Off
  • Panel alignment controls and update throttling for performance


Performance and stability:

  • Uses Last Close for calculations. No repainting behavior.
  • Update throttle to reduce CPU usage on busy workspaces.
  • Defensive handling for symbol data, broker constraints, and missing account fields.


Important notes:

  • QX RiskShield is a decision-support tool, not financial advice.
  • Results depend on your broker symbol specifications (pip value, lot size, minimum volume, etc.).
  • Auto equity is best effort. If the platform restricts access, RiskShield safely falls back to manual equity.


Ideal for:

  • FX Majors and index traders
  • Prop firm style risk rules
  • Scalpers and day traders who want fast sizing with strict safety checks
  • Traders who prefer price-based SL but still want automated sizing


Trade with control. Size with precision.

Indicator profile
0.0
รีวิว: 0
รีวิวจากลูกค้า
ยังไม่มีรีวิวสำหรับผลิตภัณฑ์นี้ หากเคยลองแล้ว ขอเชิญมาเป็นคนแรกที่บอกคนอื่น!
BTCUSD
Forex
Signal
Breakout
RSI
Indices
EURUSD
Commodities
GBPUSD
NZDUSD
Fibonacci
MACD
Bollinger
ZigZag
Scalping
ATR
Supertrend
Crypto
Grid
AI
XAUUSD
NAS100
USDJPY
Products available through cTrader Store, including trading bots, indicators and plugins, are provided by third-party developers and made available for informational and technical access purposes only. cTrader Store is not a broker and does not provide investment advice, personal recommendations or any guarantee of future performance.

เพิ่มเติมจากผู้เขียนคนนี้

Free educational Renko cBot made to help traders learn how Renko automation works and to showcase my development style.
"QX Heatmap Scanner" โลโก้
$ 19
/
$38
Multi-timeframe heatmap scoring Direction, Strength & Volatility at a glance!
"QX SessionBox ORB" โลโก้
$ 22
/
$42
QX SessionBox ORB: Session boxes + ORB levels + clean dashboard with optional closed-candle breakout signals.
"QX SmartStructure" โลโก้
$ 26
/
$50
SMC without the mess: Clean structure + auto-managing FVGs + MTF panel. Hard-right-edge, step size-based for any symbol.
"QX FrameForge" โลโก้
$ 19
/
$29
Multi-timeframe market-state dashboard: Score (-100..+100) + UP/NEUT/DN per TF, with optional closed-candle arrows.
Real-time multi-asset correlation matrix with 5 themes, Δ% performance tracking, and full customization. Up to 12 symbol
"QX CandlePressureIndex" โลโก้
$ 25
/
$45
Candle pressure overlay for cTrader. Instantly read close strength, directional bias, and momentum quality.
Pivot Points (Classic/Fibo/Camarilla/Woodie) with price zones, multi-timeframe confluence (D/W/M) and smart alerts.
Liquidity sweeps without clutter. Equal highs/lows pools, sweeps + reclaim, filters + compact panel. StepSize-based.
Session Volume Profile + Composite. POC/VAH/VAL, Focus/Solo. Fast, clean, no ghosts, live-ready.
Learn candlestick patterns with live signals, objective rules, context notes, and an interactive quiz training mode.

นอกจากนี้คุณยังอาจชอบ

Spot Inside Bar breakouts across all timeframes on cTrader
"DecisionGate" โลโก้
$ 22
DecisionGate is a context-based trade permission indicator for cTrader. It helps you avoid low-quality trades by evaluat
"Swing Levels" โลโก้
4.0
(2)
ฟรี
🔍 Automatically detect support and resistance levels based on "swings" or pivots
Filters market regimes (trend/range/pullback) using MAs, ADX, ATR/BBW Vol, opt. Volume. Helps adapt strategy. 📉📈
Fractal Arrow Buy and Sell Indicator
Auto-detect support and resistance & structure, highlight pullbacks/BOS retests, and filter with candle confirmation.
Momentum oscillator identifying reversals using dual WaveTrend lines, histogram, and OB/OS levels with optional signals.
"market session" โลโก้
4.6
(5)
ฟรี
Market session indicator (Asia, Frankfurt, New York, London)
Customize the MACD! Choose colors, get real-time tick updates, and see crossover points for enhanced trading precision.
EMA dragon combination moving averages, and volume signal, ideal long trends, h4 chart,
"Precision Swing Points" โลโก้
$ 22
/
$35
PSP is a professional-grade trading tool built to detect candle-level SMT divergence between correlated markets
Dominio del mercado. BOS/CHOCH + Liquidez con precisión quirúrgica. ESPAÑOL
"RangeBoxFibonacci" โลโก้
5.0
(1)
$ 19
With this Fibonacci retracement indicator, traders have full control over the retracement levels displayed on the chart.
"SMT Divergence Pro" โลโก้
$ 47
SMT Divergence Pro detects bullish and bearish SMT divergences between correlated markets for precise trade entries.
🎯 Auto-plots key zones (Accumulation, Manipulation, Distribution) . Reveals institutional traps & trends.
🔮Channel Price Predictor: Anticipates future price zones with trend channels based on volatility and projections." 📈
Previous day key levels indicator
Gann Pivot Vision is an innovative analytical tool that combines classic pivot reversal levels and Gann geometry
34.45M
ปริมาณการเทรด
194.05K
Pips ที่ได้กำไร
9
การขาย
213
ติดตั้งฟรี