
Opis
Jak handlować za pomocą strategii Donchiana (Breakout)
- Kupuj, gdy cena przebija najwyższy poziom z N-okresów (Górny).
- Sprzedaj, gdy cena przebija najniższy poziom z N-okresów (Dolny).
- Trzymaj pozycję, dopóki trend trwa; wyjdź przy przeciwnym wybiciu lub za pomocą trailing stopa.
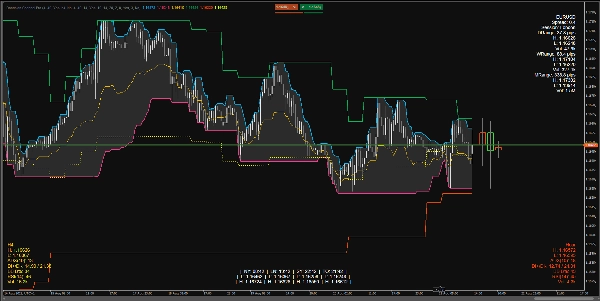
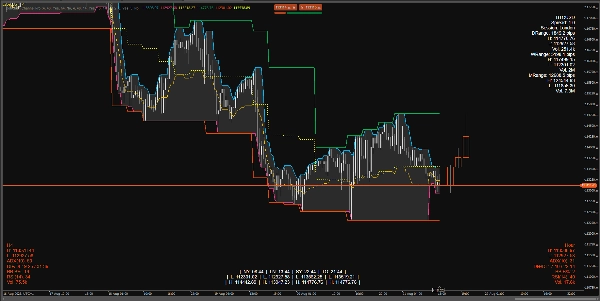
Co wskaźnik pokazuje na wykresie
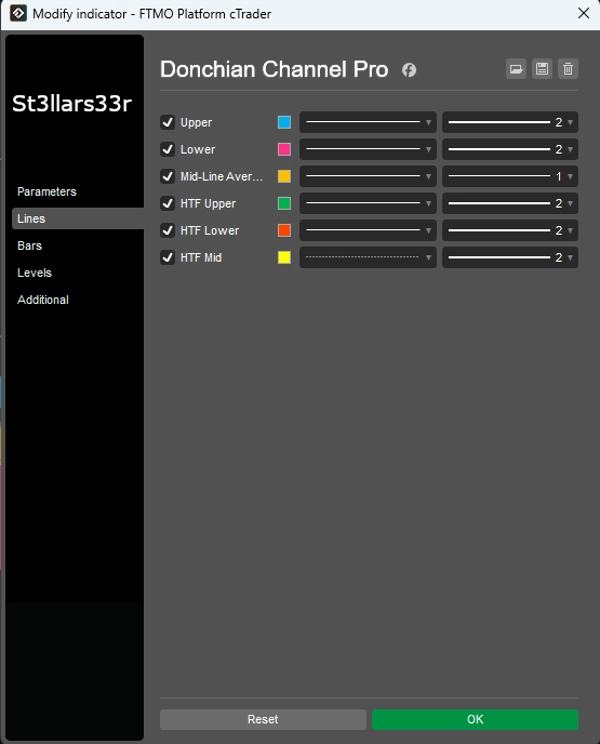
Donchian na bieżącym interwale czasowym (TF):
- Górny: Najwyższa cena w obrębie słupków Górnego Kanału.
- Dolny: Najniższa cena w obrębie słupków Dolnego Kanału.
- Środkowy: Punkt środkowy między Górnym a Dolnym.
Nakładka HTF: Linie Donchiana z wyższego interwału czasowego nałożone na wykres:
- HTF Górny, HTF Dolny, HTF Środkowy
- HTF Świece HUD: Prostokąty reprezentujące świece z wyższego interwału, zakotwiczone po prawej stronie ostatniego słupka na bieżącym TF.
HUD-y (Heads-Up Displays) na dole/górze:
- TopRight: Panel informacyjny dla symbolu + dzienne/tygodniowe/miesięczne zakresy.
- BottomLeft: HUD HTF (metryki dla wyższego interwału).
- BottomRight: HUD Mid TF (metryki dla średniego interwału).
- BottomMid: Zegary sesyjne + High/Low dla każdej sesji (trwałe).
Co wyświetla każdy HUD
TopRight (prawy górny)
- Nazwa symbolu
- Spread: Spread w pipsach.
- Sesja: Aktualnie aktywna sesja (na podstawie określonych godzin).
- DRange/WRange/MRange: Dzienne/tygodniowe/miesięczne zakresy w pipsach.
- H/L/Vol: High/Low i całkowity wolumen za dany okres.
BottomLeft (lewy dolny) — HUD HTF
- Nazwa TF (np. H4, D1 itd.)
- H/L: Aktualne maksimum/minimum ostatniego (lub aktywnego) słupka HTF.
- ADX(n), DI+/DI-: Wskaźniki trendu.
- BB B%: Pozycja bieżącej ceny względem Bollinger Bands na HTF (0 blisko dolnej wstęgi, 100 blisko górnej).
- RSI(n)
- Vol: Wolumen na HTF.
- Kolor HUD:
-
- Zielony: Zakres rozszerza się w górę (DI+ i ADX rosną).
- Czerwony: Narastający nacisk spadkowy (DI- rośnie).
- Żółty: Neutralny/niezdefiniowany.
BottomRight (prawy dolny) — HUD Mid TF
- Tak samo jak HUD HTF, ale dla średniego interwału (Mid Timeframe).
BottomMid (środek na dole) — Zegary + H/L sesji
- Czas w NY, LN, SY, TO.
- L/H dla każdej sesji.
- Logika trwałości: Gdy sesja jest nieaktywna, pokazuje H/L ostatniej zakończonej sesji; gdy zaczyna się nowa sesja, wartości są resetowane i przeliczane.
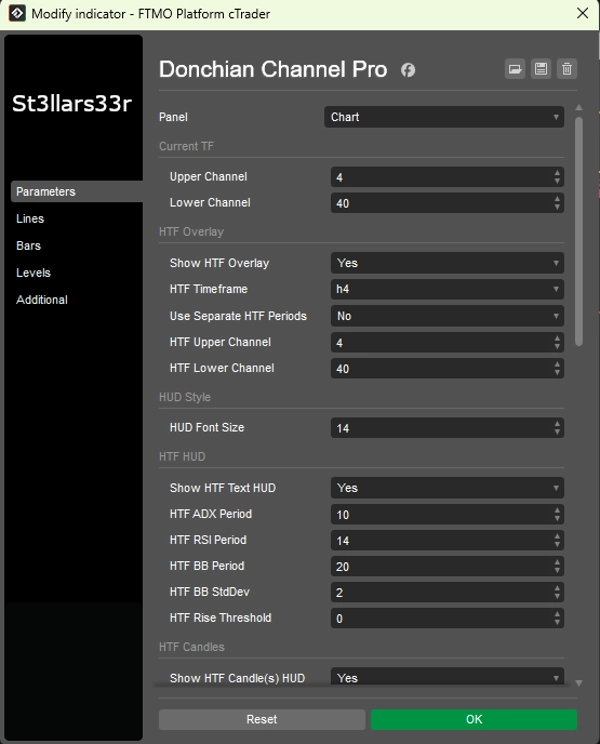
Parametry i jak ich używać
Grupa: Bieżący TF (Bieżący Donchian)
- Górny kanał: Liczba słupków dla górnego kanału. Większa wartość = rzadsze aktualizacje, bardziej płaska linia.
- Dolny kanał: Liczba słupków dla dolnego kanału.
Grupa: Nakładka HTF (Nakładka Donchiana z wyższego interwału)
- Pokaż nakładkę HTF: Włącza linie HTF na wykresie.
- Interwał HTF: Wybierz wyższy interwał (np. Hour4).
- Użyj osobnych okresów HTF: Jeśli prawda, HTF Górny/Dolny używają własnych parametrów; jeśli fałsz, używa bieżących Górny/Dolny.
- Górny kanał HTF: Długość górnego kanału dla HTF.
- Dolny kanał HTF: Długość dolnego kanału dla HTF.
Grupa: Styl HUD
- Rozmiar czcionki HUD: Rozmiar czcionki dla wszystkich HUD-ów (TopRight, BottomLeft, BottomRight, BottomMid).
Grupa: HUD HTF (lewy dolny)
- Pokaż tekstowy HUD HTF: Wyświetl tekstowy HUD dla HTF.
- Okres ADX HTF: Okres ADX/DI. Większy = płynniejszy, mniej szumu, ale wolniejsza reakcja.
- Okres RSI HTF: Okres RSI.
- Okres BB HTF: Okres Bollinger Bands.
- Odchylenie standardowe BB HTF: Mnożnik odchylenia standardowego dla BB (klasycznie 2.0).
- Próg wzrostu HTF: Czułość na rosnące metryki (wpływa na kolor HUD).
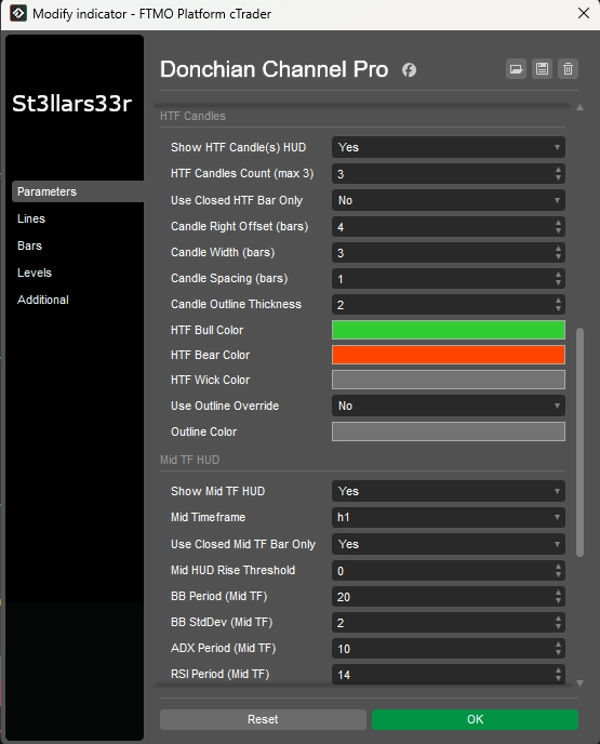
Grupa: Świece HTF (po prawej, blisko ostatniego słupka)
- Pokaż HUD świec HTF: Wyświetl świece HTF po prawej stronie.
- Liczba świec HTF (max 3): Liczba świec HTF (1–3).
- Używaj tylko zamkniętych słupków HTF: Jeśli prawda, używa tylko zamkniętych świec HTF (stabilne wartości). Jeśli fałsz, uwzględnia bieżącą otwartą świecę.
- Przesunięcie świecy w prawo (słupki): Przesunięcie w prawo w słupkach bieżącego TF od ostatniego słupka (kotwica).
- Szerokość świecy (słupki): Szerokość prostokąta świecy w słupkach bieżącego TF.
- Odstęp między świecami (słupki): Przerwa między świecami.
- Grubość obrysu świecy: Grubość obrysów świec.
- Kolor byków HTF / Kolor niedźwiedzi HTF: Kolory dla świec wzrostowych/spadkowych.
- Kolor knota HTF: Kolor knotów.
- Użyj nadpisania obrysu: Jeśli prawda, korpus świecy jest rysowany z obrysem (Kolor obrysu) bez wypełnienia byków/niedźwiedzi.
- Kolor obrysu: Kolor obrysu, gdy Użyj nadpisania obrysu = prawda.
Grupa: HUD Mid TF (prawy dolny)
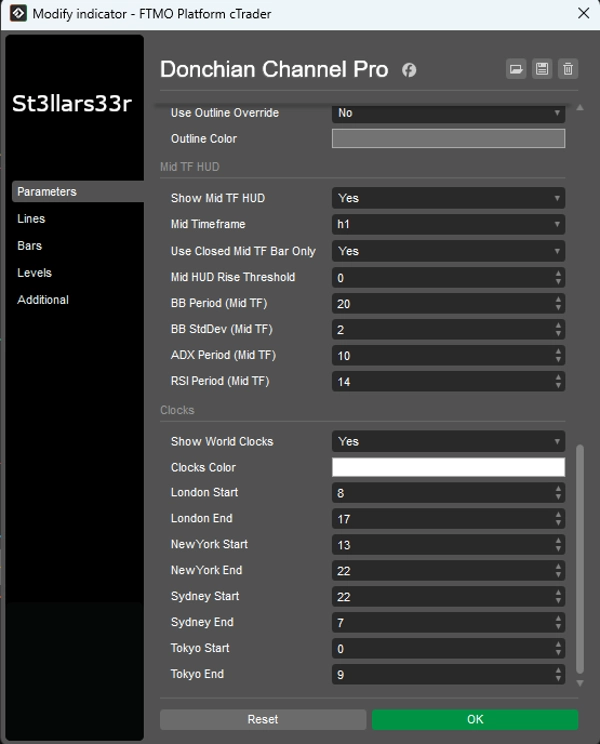
- Pokaż HUD Mid TF: Włącza HUD dla średniego TF.
- Średni interwał: Wybierz średni TF (np. Minute15).
- Używaj tylko zamkniętych słupków Mid TF: Tak samo jak HTF, ale dla Mid TF.
- Próg wzrostu HUD Mid: Czułość koloru dla HUD Mid TF.
- Okres BB (Mid TF), Odchylenie standardowe BB (Mid TF): Ustawienia Bollinger Bands dla Mid TF.
- Okres ADX (Mid TF), Okres RSI (Mid TF): Okresy ADX i RSI dla Mid TF.
Grupa: Zegary (środek na dole)
- Pokaż zegary światowe: Wyświetl blok z zegarami i H/L sesji.
- Kolor zegarów: Kolor tekstu dla zegarów/sesji.
- Start Londynu / Koniec Londynu: Godziny rozpoczęcia/zakończenia sesji londyńskiej.
- Start Nowego Jorku / Koniec Nowego Jorku: Dla Nowego Jorku.
- Start Sydney / Koniec Sydney: Dla Sydney.
- Start Tokio / Koniec Tokio: Dla Tokio.
Zegary: Pokazuje rzeczywisty lokalny czas dla miast (za pomocą stref czasowych systemu operacyjnego z zapasowym przesunięciem).
- Obliczenia aktywności sesji (i H/L) używają czasu serwera brokera (Server.Time). Jeśli serwer nie jest w UTC, godziny sesji mogą się przesunąć — dostosuj Start/Koniec według potrzeb dla swojego serwera.
- Jeśli sesja przechodzi przez północ (Koniec < Start), wskaźnik automatycznie uwzględnia zmianę daty.
- Gdy sesja jest nieaktywna, pokazuje H/L ostatniej zakończonej sesji; gdy zaczyna się nowa sesja, dane są resetowane i przeliczane.
Podsumowanie
Opinie klientów
5 | 50 % | |
4 | 50 % | |
3 | 0 % | |
2 | 0 % | |
1 | 0 % |


