
Candle Timer Toolbox
อินดิเคเตอร์
เวอร์ชัน 1.0, Nov 2025
Windows, Mac
4.4
รีวิว: 5
ตั้งแต่ 26/05/2025
506.86M
ปริมาณการเทรด
65.71K
Pips ที่ได้กำไร
17
การขาย
1.74K
ติดตั้งฟรี
คำอธิบาย
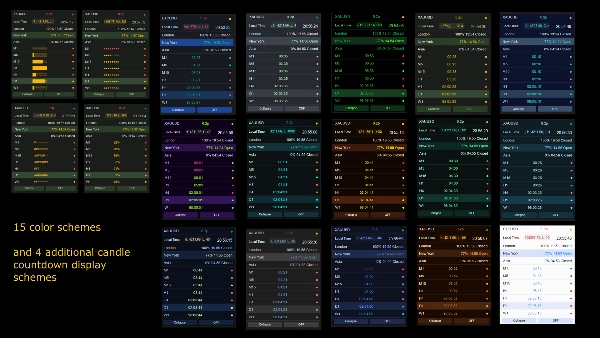
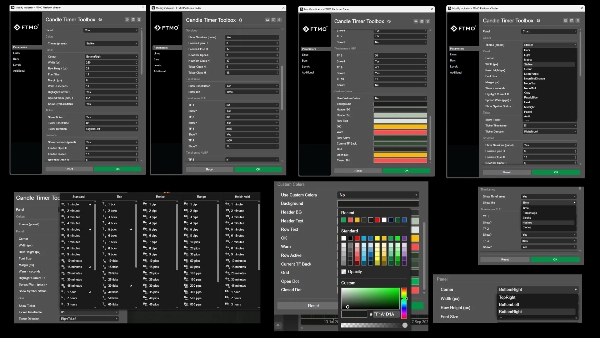
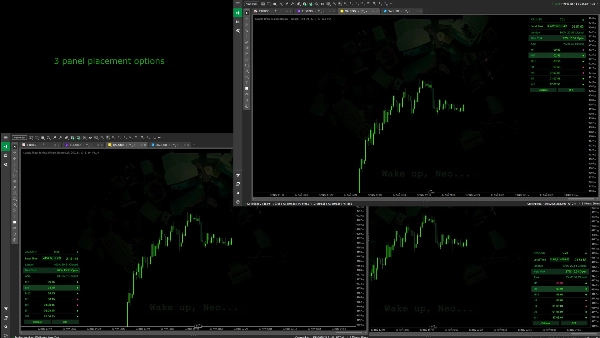
- ธีมที่ปรับแต่งได้: 15+ ชุดสีในตัว (Stalker, Matrix, Neon, ฯลฯ) และรองรับสีที่กำหนดเองโดยผู้ใช้เต็มรูปแบบ
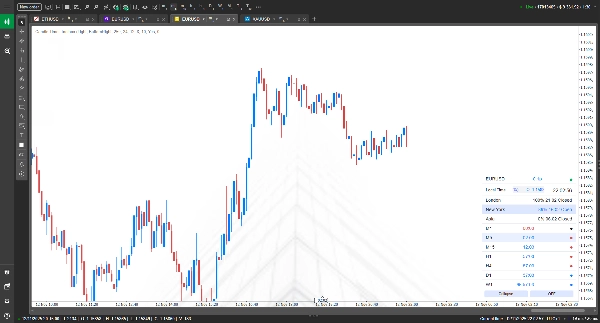
- ตัวจับเวลาหลายกรอบเวลา: ตรวจสอบการนับถอยหลังปิดแท่งเทียนได้สูงสุด 10 กรอบเวลาที่ปรับแต่งได้เต็มที่ (เช่น M1, M5, H1, D1, W1)
- โหมดตัวจับเวลาหลายแบบ: แสดงการนับถอยหลังเป็นเวลามาตรฐาน (
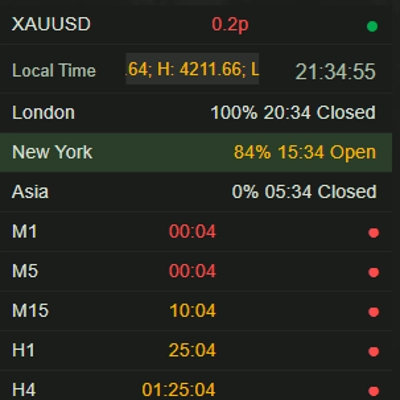
00:59), ร้อยละ (15%), หรือหนึ่งในสามแถบความคืบหน้าทางสายตา (บล็อก██░░, แฮช##==, วงกลม●●○○) - ตัวติดตามช่วงเวลาการซื้อขาย: ตรวจสอบช่วงเวลาลอนดอน นิวยอร์ก และเอเชีย แสดงเวลาท้องถิ่น ร้อยละความคืบหน้า และสถานะ "เปิด" / "ปิด" ตามชั่วโมงที่กำหนดเอง
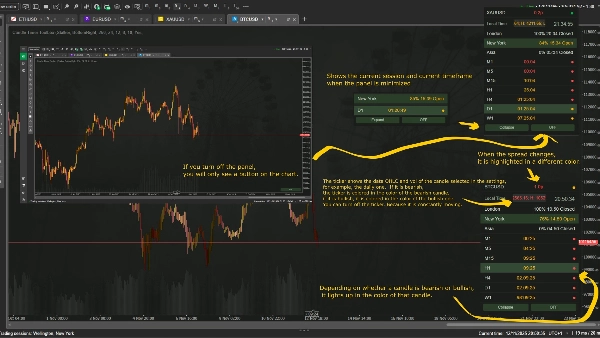
- ตัวแสดงข้อมูลเลื่อน: แสดง OHLC, ปริมาณ และ % การเปลี่ยนแปลงแบบสดสำหรับกรอบเวลาที่ผู้ใช้เลือก (เช่น D1) พร้อมทิศทางการเลื่อนที่ปรับแต่งได้
- สถานะตลาดสด: แสดงสัญลักษณ์ปัจจุบัน สเปรดสด และจุดแสดงว่าตลาดเปิดหรือปิด
- คำเตือนทางสายตา:
-
- ตัวจับเวลาจะเปลี่ยนสีเมื่อการนับถอยหลังต่ำกว่าจำนวนวินาทีที่ตั้งไว้ (เช่น 10 วินาที)
- ค่าสเปรดจะเปลี่ยนสีหากเกินค่าพิปที่ผู้ใช้กำหนด (เช่น 0.2p)
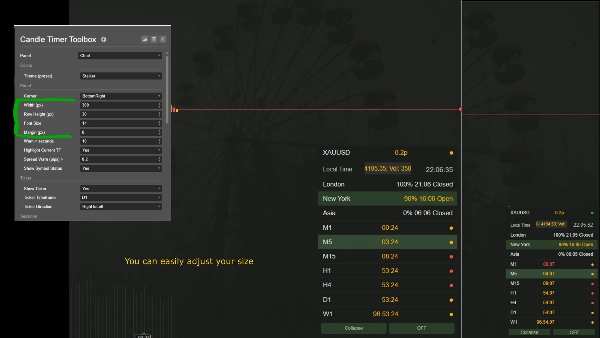
- เลย์เอาต์ที่ยืดหยุ่น: ปรับความกว้างแผง ความสูงแถว ขนาดตัวอักษร และระยะขอบบนชาร์ตได้เต็มที่
- การควบคุมแผง: ย่อแผงได้ง่าย (เพื่อแสดงข้อมูลสำคัญเท่านั้น) หรือซ่อน/เรียกแผงด้วยปุ่ม "เปิด" / "ปิด"
- การเน้นอัจฉริยะ: เน้นกรอบเวลาที่ใช้งานบนชาร์ตโดยอัตโนมัติในรายการตัวจับเวลา
สรุป
สรุปโดย AI
Candle Timer Toolbox is a customizable multi-timeframe panel designed for trading platforms. It provides countdown timers for candle closes across up to 10 user-defined timeframes, including M1, M5, H1, D1, and W1. Users can choose from multiple timer display modes such as standard time, percentage, or visual progress bars (blocks, hashes, circles). The panel tracks major trading sessions—London, New York, and Asia—showing local time, session progress, and open/closed status based on customizable hours.
Additional features include a scrolling data ticker displaying live OHLC, volume, and percentage change for a selected timeframe, and live market status indicators showing the current symbol, spread, and market open/closed status. Visual warnings highlight timers when countdowns fall below a set threshold and change spread color if it exceeds a user-defined pip value.
The interface supports over 15 built-in color themes with full customization options, adjustable panel width, row height, font size, and chart margins. Panel controls allow collapsing or toggling visibility, and smart highlighting automatically marks the active chart timeframe in the timer list. The tool supports various markets and symbols including Forex, indices, commodities, crypto, and stocks.
Additional features include a scrolling data ticker displaying live OHLC, volume, and percentage change for a selected timeframe, and live market status indicators showing the current symbol, spread, and market open/closed status. Visual warnings highlight timers when countdowns fall below a set threshold and change spread color if it exceeds a user-defined pip value.
The interface supports over 15 built-in color themes with full customization options, adjustable panel width, row height, font size, and chart margins. Panel controls allow collapsing or toggling visibility, and smart highlighting automatically marks the active chart timeframe in the timer list. The tool supports various markets and symbols including Forex, indices, commodities, crypto, and stocks.
โปรไฟล์อินดิเคเตอร์
การสนทนา
รีวิวจากลูกค้า
4.4
รีวิว: 5
5 | 40 % | |
4 | 60 % | |
3 | 0 % | |
2 | 0 % | |
1 | 0 % |
รีวิวจากลูกค้า
November 27, 2025
tbh it is not magic, just a decent extra filter. Rushing the entry still ruins the plan.
November 23, 2025
Bad ideas get easier to avoid, but it works better with a written plan.
November 19, 2025
Kinda useful when the chart is messy. The final no still belongs to the trader.
November 16, 2025
A few ugly trades are useful in the sample, and the trade review has a better rhythm.
November 15, 2025
the first 10 trades should stay boring. It helps the trader stay selective.
คำถามที่พบบ่อย
BTCUSD
Forex
Signal
Indices
EURUSD
Commodities
GBPUSD
NZDUSD
Fibonacci
Prop
ZigZag
Supertrend
SMC
Crypto
Stocks
XAUUSD
NAS100
USDJPY
VWAP
ผลิตภัณฑ์ที่มีให้บริการผ่าน cTrader Store รวมถึงบอทการเทรด อินดิเคเตอร์ และปลั๊กอิน มีให้บริการโดยนักพัฒนาบุคคลที่สามและมีไว้เพื่อวัตถุประสงค์ในการเข้าถึงข้อมูลและทางเทคนิคเท่านั้น cTrader Store ไม่ใช่โบรกเกอร์และไม่ได้ให้คำแนะนำการลงทุน คำแนะนำส่วนบุคคล หรือการรับประกันผลการดำเนินงานในอนาคต











!["[Stellar Strategies] Inside Bar with Signals" โลโก้](https://cdn.ctrader.com/image/webp/1d9e8bfa-3b2c-4440-bb37-5856902008a7_30683)









ราคา
ตั้งแต่ 26/05/2025
506.86M
ปริมาณการเทรด
65.71K
Pips ที่ได้กำไร
17
การขาย
1.74K
ติดตั้งฟรี