
คำอธิบาย
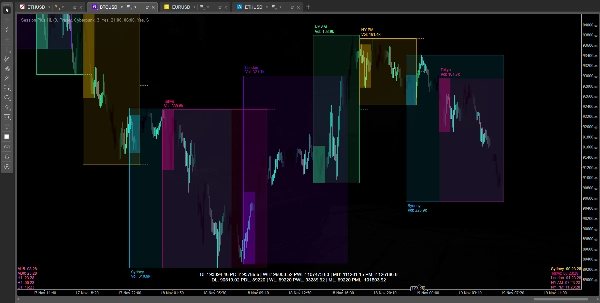
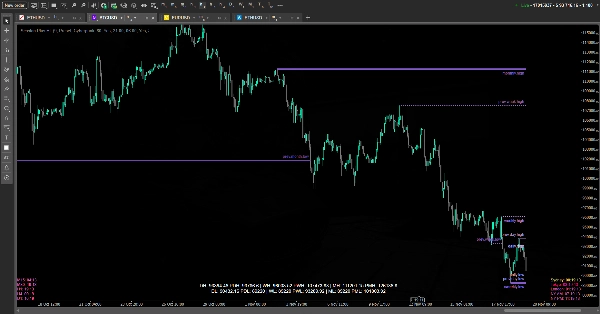
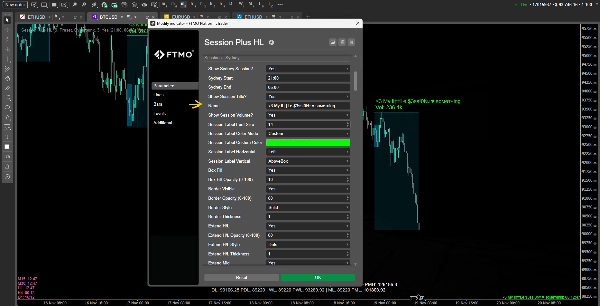
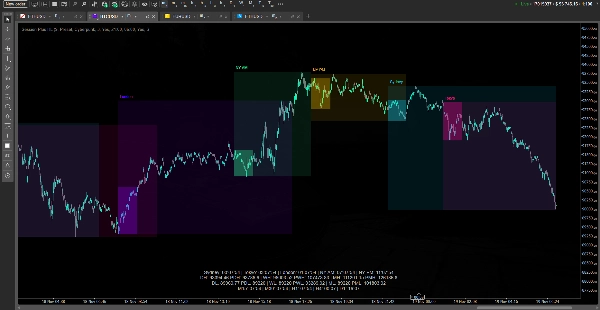
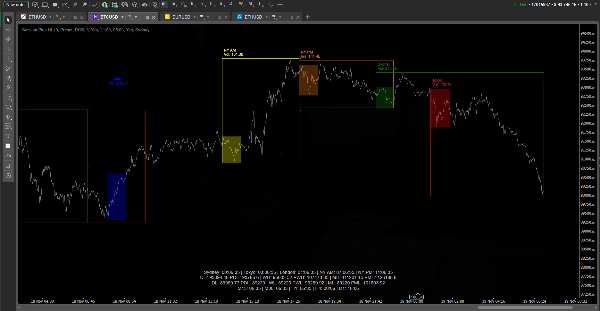
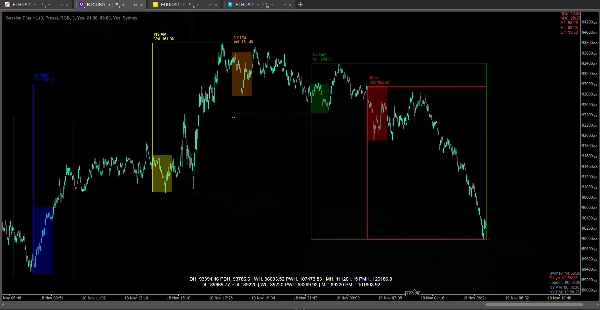
ตัวบ่งชี้นี้ถูกออกแบบมาเพื่อแสดงโครงสร้างตลาดและบริบทตามเวลาสำหรับผู้ซื้อขายภายในวัน โดยจะวางกรอบช่วงการซื้อขายหลัก (ซิดนีย์ โตเกียว ลอนดอน นิวยอร์ก ช่วงเช้า/บ่าย) อัตโนมัติบนกราฟ แสดงระดับสูง/ต่ำและระดับกลางที่เลือกได้ และสามารถเน้นช่วง Initial Balance (IB) ภายในแต่ละช่วงการซื้อขายได้ นอกจากนี้ยังวาดระดับอ้างอิงสำคัญจากกรอบเวลาที่สูงกว่า — สูงและต่ำของวัน/สัปดาห์/เดือนปัจจุบันและก่อนหน้า — และแสดงทั้งในรูปแบบเส้นบนกราฟและแดชบอร์ดขนาดกะทัดรัด เพื่อให้คุณเห็นตำแหน่งราคาที่สัมพันธ์กับกลุ่มสภาพคล่องล่าสุดเสมอ
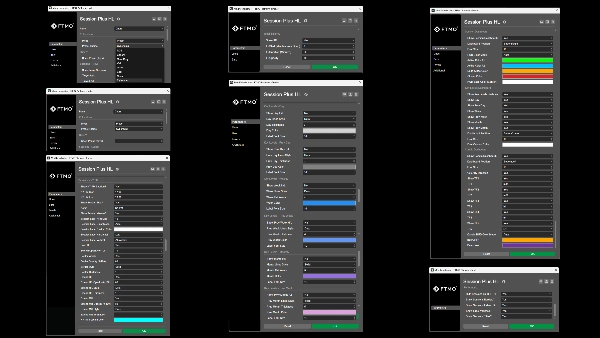
นอกจากนี้ ตัวบ่งชี้ยังมี HUD หลายแบบ: แดชบอร์ดช่วงการซื้อขายที่แสดงเวลาที่เหลือจนกว่าจะเปิดหรือปิดแต่ละช่วง, แดชบอร์ดระดับสำคัญที่สรุปค่าระดับสูง/ต่ำรายวัน/รายสัปดาห์/รายเดือนทั้งหมด, และแดชบอร์ดแท่งเทียนที่แสดงเวลาที่เหลือในแท่งเทียนบนกรอบเวลาที่สูงกว่าหลายระดับและสถานะกระทิง/หมีของแท่งเทียนเหล่านั้น ภาพทั้งหมดสามารถปรับธีมได้ (ตั้งค่าสีล่วงหน้าหรือสีที่กำหนดเอง), ปรับแต่งเพื่อประสิทธิภาพ (ซ่อนช่วงการซื้อขายบนกรอบเวลาที่สูงกว่า, ควบคุมเส้นสั้นแทนการขยายแบบไดนามิกหนักๆ) และถูกออกแบบมาเพื่อสนับสนุนการวิเคราะห์การกวาดสภาพคล่อง ช่วงการซื้อขาย และการจับเวลาที่ไม่ทำให้กราฟรกหรือช้า
สรุป
รีวิวจากลูกค้า
5 | 0 % | |
4 | 50 % | |
3 | 50 % | |
2 | 0 % | |
1 | 0 % |


