

present
Daftar dan dapatkan diskon $50 untuk pembelian pertama Anda
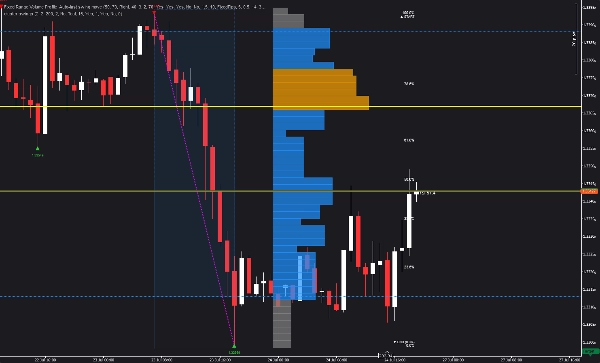
Trading product for Fixed Range Volume Profile  Auto-last swing move Indikator Fibonacci Key Levels, image 1
Fixed Range Volume Profile Auto-last swing move
Indikator
Versi 1.0, Jul 2026
Windows, Mac
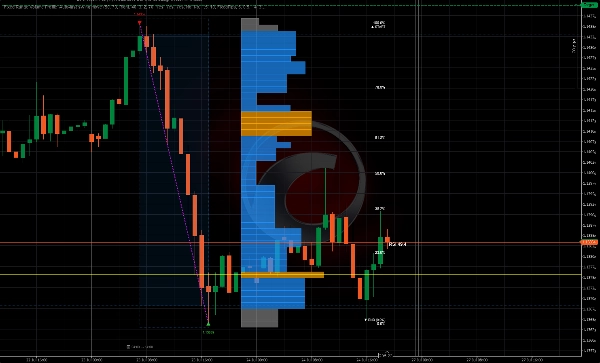
Trading product for Fixed Range Volume Profile  Auto-last swing move Indikator Fibonacci Key Levels, image 2
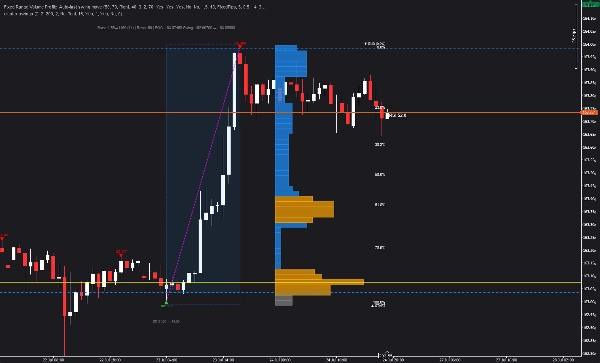
Trading product for Fixed Range Volume Profile  Auto-last swing move Indikator Fibonacci Key Levels, image 3
Trading product for Fixed Range Volume Profile  Auto-last swing move Indikator Fibonacci Key Levels, image 4
Sejak 14/01/2025
2
Penjualan
157
Instal gratis

Deskripsi

PROFIL VOLUME AYUNAN (SVP)

Profil Volume Berbasis Ayunan + Fibonacci + RSI


--------------------------------------------------


Deteksi ayunan. Profil volume. Fibonacci. RSI. Semua dalam satu.


--------------------------------------------------


APA YANG DILAKUKAN INDIKATOR INI


Profil Volume Ayunan (SVP) secara otomatis mendeteksi ayunan struktural dan menampilkan profil volume untuk ayunan yang baru selesai — dengan overlay retracement Fibonacci dan RSI.


Tidak perlu pemilihan rentang manual. Indikator menemukan ayunan dan membangun profil secara otomatis.


--------------------------------------------------


FITUR UTAMA


- DETEKSI AYUNAN OTOMATIS (kedalaman dan deviasi yang dapat dikonfigurasi)

- Profil Volume untuk ayunan terakhir yang selesai

- Titik Kontrol (POC) - level volume tertinggi

- Area Nilai (VAH + VAL) - persentase yang dapat dikonfigurasi

- Node Volume Tinggi (HVN) - volume di atas ambang rata-rata

- Retracement Fibonacci (0, 23.6, 38.2, 50, 61.8, 78.6, 100)

- Overlay RSI di dekat harga saat ini

- Posisi histogram: Kiri, Kanan, atau Dekat Bar

- Baris yang dapat dikonfigurasi (10 hingga 200)

- Warna dan opasitas yang dapat disesuaikan

- Perpanjang garis ke kanan

- Tampilkan/sembunyikan label harga

- Tidak ada repainting


--------------------------------------------------


CARA KERJANYA


1. Indikator mendeteksi ayunan menggunakan kedalaman dan deviasi yang dapat dikonfigurasi

2. Ayunan terakhir yang selesai diidentifikasi

3. Profil volume dihitung dari rentang ayunan

4. POC, VAH, VAL, HVN ditampilkan

5. Retracement Fibonacci ditumpangkan pada ayunan

6. RSI saat ini ditampilkan di dekat harga


Semua otomatis. Tidak perlu input manual.


--------------------------------------------------


ELEMEN VISUAL


- Segitiga merah ke bawah = Puncak ayunan

- Segitiga hijau ke atas = Dasar ayunan

- Garis putus-putus magenta = Koneksi ayunan

- Garis horizontal kuning = Titik Kontrol (POC)

- Garis putus-putus biru = Area Nilai Tinggi (VAH) dan Area Nilai Rendah (VAL)

- Bar oranye = Node Volume Tinggi (HVN)

- Bar abu-abu = Node volume rendah

- Garis horizontal emas = Level Fibonacci

- Label putih = Persentase Fibonacci

- Nilai RSI = RSI saat ini di dekat harga


--------------------------------------------------


RINGKASAN PARAMETER


PENGATURAN PROFIL:

- Jumlah Baris: Berapa banyak baris harga (10-200)

- Persentase Area Nilai: % volume di area nilai (1-100)


PENGATURAN VISUAL:

- Posisi Histogram: Kanan, Kiri, Dekat Bar, atau Dekat Bar Kiri

- Lebar Histogram %: Lebar bar histogram

- Skala Lebar Bar: Faktor skala untuk lebar bar

- Lebar Bar Minimum %: Lebar bar minimum

- Opasitas Bar: Transparansi bar (10-100)


DETEKSI AYUNAN:

- Kedalaman Ayunan: Berapa banyak bar yang diperiksa untuk ekstrem lokal

- Mode Deviasi: Pips Tetap atau Berbasis ATR

- Deviasi Tetap: Jarak pip minimum antara ayunan

- Pengali Deviasi ATR: Pengali untuk deviasi berbasis ATR

- Periode ATR: Periode untuk perhitungan ATR

- Backstep: Bar minimum antara ayunan


VISUAL - AYUNAN:

- Tampilkan Garis Ayunan: Aktifkan garis ayunan magenta

- Warna Garis Ayunan

- Tampilkan Label Ayunan: Aktifkan label harga

- Warna Ayunan Tinggi/Rendah


VISUAL - FIBONACCI:

- Tampilkan Retracement Fib: Aktifkan overlay Fibonacci

- Tampilkan Garis Fib: Aktifkan garis horizontal

- Tampilkan Label Fib: Aktifkan label persentase

- Warna Garis Fib / Warna Teks Fib


VISUAL - RSI:

- Tampilkan Nilai RSI: Aktifkan overlay RSI

- Periode RSI: Periode untuk perhitungan RSI

- Warna Label RSI


WARNA:

- Warna POC / Warna Area Nilai / Warna Node Volume Tinggi / Warna Volume Rendah


--------------------------------------------------


KASUS PENGGUNAAN


- Identifikasi ayunan dan distribusi volume dalam satu tampilan

- Temukan Titik Kontrol (POC) untuk entri dan keluar

- Gunakan Area Nilai (VAH/VAL) untuk target keuntungan

- Temukan Node Volume Tinggi (HVN) untuk level kunci

- Terapkan retracement Fibonacci pada ayunan

- Konfirmasi perdagangan dengan konfluensi RSI

- Pahami distribusi volume secara sekilas


--------------------------------------------------


TINGKATKAN KE ZONA PANAS STRUKTURAL


Indikator ini menunjukkan ayunan dan distribusi volume.


Zona Panas Struktural membawa lebih jauh — memetakan intensitas partisipasi, penerimaan vs penolakan, dan keterlibatan pasar di berbagai zona.


Cari Zona Panas Struktural di cTrader Store.


--------------------------------------------------


TINGKATKAN KE INVICTUS EA


Invictus EA menggunakan teknologi struktural untuk mengeksekusi perdagangan otomatis.


Cari Invictus di cTrader Store.


--------------------------------------------------


CATATAN TEKNIS


- Indikator overlay

- Bekerja pada semua timeframe dan simbol

- Tidak ada repainting (perhitungan historis)

- Dioptimalkan untuk performa


--------------------------------------------------


DUKUNGAN


Pembaruan seumur hidup termasuk.


UNTUK INFORMASI LEBIH LANJUT - Klik Profil Pengembang di bawah.

Ringkasan

Ringkasan AI
Fixed Range Volume Profile Auto-last swing move is an overlay indicator designed for any timeframe and symbol that automatically detects structural swings and calculates a volume profile for the most recent completed swing. It integrates multiple analytical tools including Point of Control (POC), Value Area High and Low (VAH/VAL), High Volume Nodes (HVN), Fibonacci retracement levels (0%, 23.6%, 38.2%, 50%, 61.8%, 78.6%, 100%), and a Relative Strength Index (RSI) overlay near the current price.

The indicator identifies swings using configurable parameters such as swing depth and deviation mode (fixed pips or ATR-based), then computes volume distribution within the swing range without requiring manual range selection. Visual elements include colored markers for swing highs and lows, volume nodes, Fibonacci levels, and RSI values, all customizable in terms of color, opacity, and histogram positioning.

Key features include no repainting, configurable rows for volume profile resolution, extendable lines, and toggleable price labels. Use cases focus on identifying swing structures, volume distribution, key price levels, and confluences for trade entries, exits, and profit targets. The indicator is optimized for performance and provides lifetime updates.

Profil indikator
Kategori indikator
Volatilitas
Tipe output
Visualisasi
Persyaratan data
Hanya batang
Data tick
Sinyal yang didukung
Cross
Divergen
Breakout
Reversal
Kekuatan tren
Volatilitas
Level tersentuh
Level tertembus
Rentang sesi pembukaan

Ulasan pelanggan

0.0
Ulasan: 0
Ulasan pelanggan
Belum ada ulasan untuk produk ini. Sudah mencobanya? Jadilah pemberi ulasan pertama!

Diskusi

Pertanyaan umum

Fibonacci
Key Levels
RSI
Volume
Support & Resistance
Produk-produk yang tersedia melalui cTrader Store, termasuk bot trading, indikator, dan plugin, disediakan oleh pengembang pihak ketiga serta hanya ditujukan untuk akses teknis dan informasi. cTrader Store bukan broker dan tidak menyediakan saran investasi, rekomendasi pribadi, atau jaminan apa pun tentang kinerja di masa mendatang.

Produk lain dari penulis ini

Indikator
ATR
RSI
+5
Free swing detector with Fibonacci retracement and RSI overlay. Auto-deviation adapts to any timeframe
Indikator
Volume
Imbalance
+1
Volume profile indicator that auto-detects the latest trendline. Shows POC, Value Area (VAH/VAL), and High Volume Nodes
cBot
ATR
Wedge
+5
15 YEARS RESULTS :Win rate:93% | ROI+19000% | Trades:87,000 | Profit Factor 1.2 | Currency Pairs:22 | $10k to 500k$ |
1.2
Faktor laba
Indikator
ATR
BOS
+5
Heat intensity mapping of structural participation. See where price fights, where it accepts, and where it rejects .

Anda mungkin juga suka

Indikator
AI
SMC
+4
Weekly Daily Opening Gaps — NWOG & NDOG Indicator Professional-grade opening gap visualization for institutional traders
Indikator
MACD
Forex
+5
🚀 MACD Pro Trader – Advanced MACD with buy/sell signals, custom MAs & color-coded histograms for smarter trading! 📈🔥
Indikator
ATR
Volume
+3
Fibonacci trend signals on closed bars, with an ATR stop, up to four targets and a break-even ladder.
Indikator
Volume
Order Block
+4
Advanced Pro Volume Profile: Double Back-to-Back, Institutional Dynamic, Fixed Range & Order Flow
Indikator
Forex
Identify 34 candlestick patterns, track trends across timeframes, and get instant alerts with this powerful trading tool
Indikator
SMC
Prop
+14
FVG Multi Time Frame Indicator
Indikator
Forex
Crypto
+2
A powerful cTrader indicator with customizable Moving Average alerts, notifications, and automated trading actions.
Indikator
Prop
Forex
+7
Multi-timeframe moving averages with session lines for structured trend analysis directly on the chart.
Indikator
Volume
Key Levels
+2
Support and resistance from a rolling volume profile, ranked by strength or recency, updated live.
Indikator
Engulfing
Fibonacci
+4
Six higher-timeframe candle sets on one chart, with liquidity sweep detection and swept levels.
Indikator
ATR
EMA
+3
The UTBot you know from TradingView — now on cTrader with confirmed signals, VWAP, EMA and session overlays.
Indikator
Volume
Channel
+3
A higher-timeframe log-regression channel with a volume profile, Point of Control and session levels.
Indikator
ATR
VWAP
+4
Structure-aware indicator that re-anchors VWAP to confirmed swing pivots.
Indikator
MACD
Prop
+8
NTNPICLL is a tool to check the best trading hours for the assets and also includes the highest and lowest point
Indikator
RSI
Forex
+10
Unlock Stochastic RSI PRO in cTrader! Overlay RSI, highlight zones, and identify divergences with customizable settings.
Indikator
ATR
RSI
+3
🚀 Specialized algorithm is designed to confirm entry and exit points with precision 🎯
Indikator
BOS
Order Block
+3
Not every order block deserves your attention.
Indikator
Forex
NZDUSD
+2
RCS: 8 majors! AUD,USD,EUR,JPY,GBP,CAD,CHF,NZD. Find how strong each currency is relatively and trade smarter!

Harga

Sejak 14/01/2025
2
Penjualan
157
Instal gratis



























