Cross-Timeframe Trend-vs-Noise Index
อินดิเคเตอร์
เวอร์ชัน 1.0, Jul 2026
Windows, Mac
Trading product for Cross-Timeframe Trend-vs-Noise Index อินดิเคเตอร์ Market Structure ATR, image 2
Trading product for Cross-Timeframe Trend-vs-Noise Index อินดิเคเตอร์ Market Structure ATR, image 3
Trading product for Cross-Timeframe Trend-vs-Noise Index อินดิเคเตอร์ Market Structure ATR, image 4
Trading product for Cross-Timeframe Trend-vs-Noise Index อินดิเคเตอร์ Market Structure ATR, image 5
ตั้งแต่ 17/09/2024
1
การขาย

คำอธิบาย

Multi Timeframe Tradeability Index

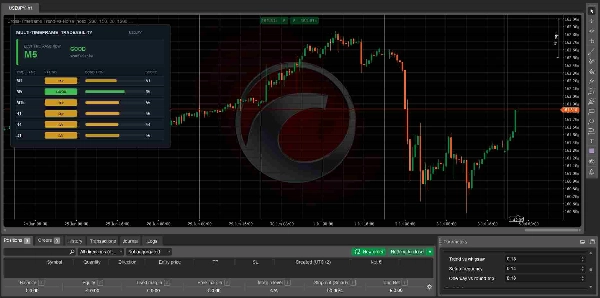
The Multi Timeframe Tradeability Index is an advanced market condition analyzer that identifies when the market is statistically favorable for trading. Instead of generating buy or sell signals, it measures how tradeable current market conditions are across multiple timeframes, allowing you to focus only on periods where price action is clean, directional, and capable of producing meaningful moves.

Unlike traditional indicators that rely on fixed thresholds, this indicator continuously adapts to each timeframe by comparing current market behavior with its own historical baseline. This self calibrating approach allows it to work across Forex, indices, commodities, cryptocurrencies, and other CFD markets without requiring manual optimization.

How It Works

The indicator evaluates six independent characteristics of the market on every timeframe.

Trend versus randomness using the Market Meanness Index.

Smoothness versus choppiness using Fractal Dimension.

Signal to noise ratio to determine whether meaningful swings dominate random fluctuations.

Trend cleanliness by measuring how efficiently price moves instead of constantly reversing.

Trading opportunity frequency by counting significant swing legs.

Net directional progress to determine whether price is making meaningful progress rather than repeatedly retracing.

Each factor is normalized relative to its own historical behavior using statistical z score analysis. This means the indicator evaluates whether current conditions are unusually favorable rather than simply above or below an arbitrary threshold.

The normalized factors are combined into a weighted score ranging from 0 to 100.

The indicator also includes a transaction cost filter that prevents short timeframes from receiving high scores when average price swings are too small to realistically overcome spreads and commissions.

Dashboard

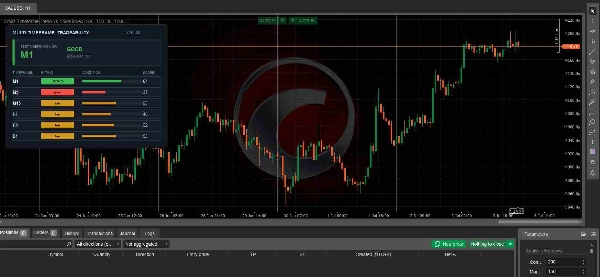
The dashboard analyzes six timeframes simultaneously.

M1

M5

M15

H1

H4

D1

Each timeframe receives one of three ratings.

GOOD indicates highly favorable market conditions.

FAIR indicates acceptable but less ideal conditions.

POOR indicates that market structure is currently unfavorable.

The indicator automatically highlights the highest scoring timeframe together with its current Tradeability Score.

Interpreting the Scores

80 to 100 indicates exceptional trading conditions with strong directional movement and low market noise.

60 to 79 indicates very good conditions where trading strategies are likely to perform well.

40 to 59 indicates average conditions where selectivity is recommended.

Below 40 indicates poor market structure with excessive randomness, choppiness, or insufficient movement.

Higher scores do not predict market direction. They simply indicate that whichever direction develops is statistically more likely to produce cleaner and more tradable price action.

Main Parameters

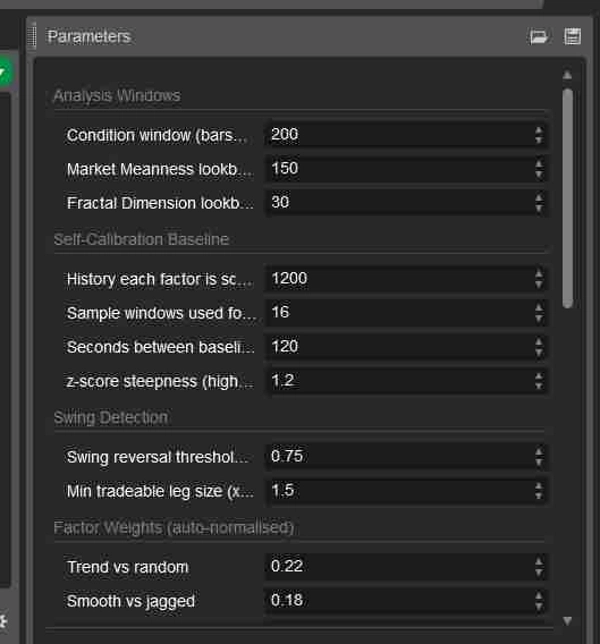
Analysis Windows control how much market history is used for calculating each factor.

Self Calibration Baseline determines how historical normalization is performed.

Swing Detection adjusts the sensitivity used for identifying significant price swings.

Factor Weights allow advanced users to emphasize or reduce the importance of each market characteristic.

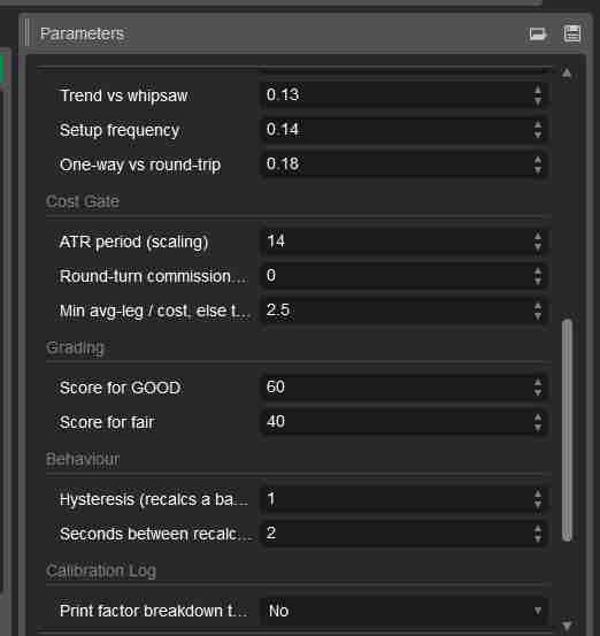
Cost Gate controls how aggressively transaction costs affect the final rating.

Grading settings define the score thresholds for GOOD and FAIR classifications.

Dashboard settings allow complete control over panel size and screen position.

Best Use Cases

Finding the most tradeable timeframe before looking for entries.

Avoiding sideways, noisy, or low quality market conditions.

Filtering signals from existing trading strategies.

Improving discretionary trading by focusing only on statistically favorable environments.

Supporting algorithmic systems with an adaptive market condition filter.

Who Is It For

This indicator is suitable for beginners who want objective guidance on when market conditions are favorable, as well as experienced discretionary and algorithmic traders looking for an adaptive market quality filter that works across multiple instruments and timeframes.

Important Notes

This indicator is not a buy or sell signal generator.

It does not predict future price direction.

It measures only the quality of current market conditions.

For best results, combine it with your existing entry, exit, and risk management strategy. The highest probability trades typically occur when your own trading setup aligns with timeframes that receive a GOOD Tradeability rating.

สรุป

สรุปโดย AI
The Cross-Timeframe Trend-vs-Noise Index is an adaptive market condition indicator designed to identify the most tradeable timeframes across multiple markets including Forex, indices, commodities, cryptocurrencies, and CFDs. It evaluates six independent market characteristics—trend versus randomness, smoothness versus choppiness, signal-to-noise ratio, trend cleanliness, trading opportunity frequency, and net directional progress—using statistical z-score normalization against historical baselines. This self-calibrating approach allows it to adapt continuously without manual optimization.
The indicator provides a weighted Tradeability Score from 0 to 100 for six timeframes (M1, M5, M15, H1, H4, D1), classifying each as GOOD, FAIR, or POOR based on current market quality. It includes a transaction cost filter to account for realistic trading conditions on shorter timeframes. The dashboard highlights the highest scoring timeframe and its score, helping traders focus on periods with clean, directional price action suitable for trading.
This tool does not generate buy or sell signals nor predict price direction; instead, it serves as a market quality filter to improve discretionary or algorithmic trading by signaling when conditions are statistically favorable. Key parameters allow customization of analysis windows, swing detection sensitivity, factor weights, and grading thresholds. It is suitable for traders seeking objective guidance on market structure and tradeability across multiple instruments and timeframes.

โปรไฟล์อินดิเคเตอร์

รีวิวจากลูกค้า

0.0
รีวิว: 0
รีวิวจากลูกค้า
ยังไม่มีรีวิวสำหรับผลิตภัณฑ์นี้ หากเคยลองแล้ว ขอเชิญมาเป็นคนแรกที่บอกคนอื่น!

การสนทนา

คำถามที่พบบ่อย

Market Structure
ATR
ผลิตภัณฑ์ที่มีให้บริการผ่าน cTrader Store รวมถึงบอทการเทรด อินดิเคเตอร์ และปลั๊กอิน มีให้บริการโดยนักพัฒนาบุคคลที่สามและมีไว้เพื่อวัตถุประสงค์ในการเข้าถึงข้อมูลและทางเทคนิคเท่านั้น cTrader Store ไม่ใช่โบรกเกอร์และไม่ได้ให้คำแนะนำการลงทุน คำแนะนำส่วนบุคคล หรือการรับประกันผลการดำเนินงานในอนาคต

เพิ่มเติมจากผู้เขียนคนนี้

อินดิเคเตอร์
BOS
CHOCH
+4
Dual-track market structure detection with BVC order flow confirmation and two-stage liquidity sweep validation.
cBot
AI
Prop
+4
This is a complex price action + Indicator based medium-long term trader cBot with advanced risk management features.
cBot
RSI
Forex
+7
This is a highly tested Indicator based DayTrader cBot with all adjustable parameters.
cBot
AI
RSI
+5
This is a complex Gold trader price action + Indicator based medium-long term trader cBot with advanced money management
cBot
RSI
Forex
+1
A precision-driven robot utilizing MFI, Stochastic, and RSI indicators to generate accurate signals.

นอกจากนี้คุณยังอาจชอบ

"Stochastic RSI PRO" โลโก้
เรตติ้งสูง
4.7
(4)
$28
/
$40
อินดิเคเตอร์
RSI
Prop
+14
Unlock Stochastic RSI PRO in cTrader! Overlay RSI, highlight zones, and identify divergences with customizable settings.
อินดิเคเตอร์
Breakout
Allow trader to visualize Support & Resistance across different timeframes,give trader an overview of the current market
อินดิเคเตอร์
EMA
SMA
+3
Pro MA Close Alert. Powerful indicator that instantly notifies you when price closes above or below your selected MA.
อินดิเคเตอร์
Customizable window inside your platform, access to any website Calendar
อินดิเคเตอร์
BOS
MSS
+3
Maps BOS, CHoCH, swing breaks and market structure shifts directly on your cTrader chart.
อินดิเคเตอร์
MSS
Market Structure
+2
Smart structural zones with pivot detection, ATR adaptation, sound alerts, and auto-color UI for precise entries.
อินดิเคเตอร์
AI
SMC
+19
ZigZag Pro — Advanced swing detection with ATR threshold, fractal confirmation, and colored segments. Clean market
อินดิเคเตอร์
Forex
Crypto
+3
MARainbow gives you the edge with four customizable moving averages—each color-coded for instant recognition.
อินดิเคเตอร์
Forex
Crypto
+3
Enhance Pitchfork & Price Channels in cTrader with customizable Equidistant and Fibonacci levels.
อินดิเคเตอร์
BOS
CHOCH
+4
Dual-track market structure detection with BVC order flow confirmation and two-stage liquidity sweep validation.
อินดิเคเตอร์
ATR
RSI
+3
🚀 Specialized algorithm is designed to confirm entry and exit points with precision 🎯
อินดิเคเตอร์
Key Levels
Market Structure
+1
HTF Candle Projector displays the current Higher Timeframe candle (4H or 1H) as a real projected candle LIVE..
อินดิเคเตอร์
AI
ATR
+20
Algorithmic trend precision for cTrader.
อินดิเคเตอร์
AI
SMC
+5
Coloring trendline/ Colored Trendline / Color Trendline
"TrendPulse VWAP" โลโก้
ยอดนิยม
5.0
(2)
$25
/
$49
อินดิเคเตอร์
ATR
VWAP
+4
Structure-aware indicator that re-anchors VWAP to confirmed swing pivots.
อินดิเคเตอร์
Forex
NAS100
+3
volumen perfile
อินดิเคเตอร์
Smoothed CCI alerts! Audio & arrow signals for +/-100 crosses. Custom sounds & arrow filters. Precision trading!
อินดิเคเตอร์
Breakout
Open Range Breakout by SLA is a fully customizable multi-session indicator designed for structured intraday traders.

ราคา

ตั้งแต่ 17/09/2024
1
การขาย