
คำอธิบาย
มีเวอร์ชันอัปเดตแล้ว — ที่นี่
มีการปล่อยเวอร์ชันอัปเดตของตัวชี้วัดนี้พร้อมการแก้ไขและปรับปรุงที่สำคัญ:
- แก้ไขการแจกแจงปริมาณ: การจัดสรรตามสัดส่วนโดยอิงจากการทับซ้อนของแท่งเทียน (แทนที่จะเป็น 100% สำหรับทุกระดับที่สัมผัส)
- แก้ไขการตรวจจับ VAH/VAL: ความทนทานขยายตามความสูงของระดับแทนค่าที่ตั้งไว้ล่วงหน้า
- แก้ไขตำแหน่งข้อความ: การเลื่อนตำแหน่งตามกรอบเวลาที่เปลี่ยนแปลงแทนวันที่ตั้งไว้ล่วงหน้า
- พารามิเตอร์การเลื่อนเขตเวลา: สำหรับโปรไฟล์วันที่และเวลา
- พารามิเตอร์ตำแหน่งข้อความ: ตัวเลือกการวางซ้าย/ขวาสำหรับโหมดย้อนกลับ
- ปรับปรุงประสิทธิภาพ: การค้นหาแบบไบนารีสำหรับการค้นหาวันที่และเวลา, การคำนวณปริมาณที่แคชไว้, การดำเนินการพจนานุกรมที่ปรับให้เหมาะสม
__________________________________________________________________________________________
หมายเหตุสำคัญ - อ่านก่อน
ปริมาณฟอเร็กซ์ไม่ใช่ปริมาณจริง
ปริมาณในฟอเร็กซ์คือปริมาณการเคลื่อนไหวของราคา — นับจำนวนครั้งที่ราคามีการเปลี่ยนแปลง ไม่ได้นับจำนวนเงินที่ถูกซื้อขาย
สิ่งที่ปริมาณการเคลื่อนไหวราคาไม่สามารถแสดงได้
- ขนาดการซื้อขาย การซื้อขายมูลค่า $100 และ $10,000,000 ทั้งคู่ถูกนับเป็น 1 การเคลื่อนไหว
- กระแสเงินสดจริง คุณไม่สามารถเห็นได้ว่าเงินจำนวนมากหรือจำนวนน้อยเป็นผู้เคลื่อนไหวราคา
- สภาพคล่องที่แท้จริง คุณไม่สามารถเห็นจำนวนคำสั่งที่รออยู่ในตลาด
- กิจกรรมของธนาคาร ธนาคารเห็นข้อมูลปริมาณจริง คุณไม่เห็น
สิ่งที่หมายความว่า
ปริมาณการเคลื่อนไหวราคาแสดงเพียงความถี่ที่ราคามีการเปลี่ยนแปลง — ไม่ใช่เงินที่อยู่เบื้องหลัง สิ่งนี้สร้างปัญหา:
- คุณไม่สามารถติดตามธนาคารหรือสถาบันได้ พวกเขาใช้ข้อมูลปริมาณจริงที่คุณไม่มีสิทธิ์เข้าถึง
- คุณไม่สามารถพิสูจน์ทฤษฎี "เงินฉลาด" ได้ แนวคิดเหล่านั้นต้องการปริมาณจริง ไม่ใช่การนับการเคลื่อนไหว
- คุณไม่สามารถประเมินสภาพคล่องที่แท้จริงได้ กิจกรรมการเคลื่อนไหวราคาไม่แสดงความลึกของคำสั่งหรือความแข็งแกร่งของตลาดจริง
- คุณไม่สามารถวัดกำลังซื้อหรือขายที่แท้จริงได้ การซื้อขายขนาดเล็กหลายรายการดูเหมือนกับการซื้อขายสถาบันขนาดใหญ่เพียงรายการเดียว
- การเพิ่มขึ้นของปริมาณอาจหลอกลวง การเพิ่มขึ้นอาจเป็นเพียงเสียงรบกวนจากอัลกอริทึม ไม่ใช่ความสนใจในการซื้อขายจริง
วิธีใช้ตัวชี้วัดนี้อย่างถูกต้อง
- ใช้เป็นเครื่องวัดกิจกรรม ไม่ใช่เครื่องวัดเงิน ปริมาณการเคลื่อนไหวราคาสูง = ตลาดคึกคัก ปริมาณการเคลื่อนไหวราคาต่ำ = ตลาดเงียบ เท่านั้น
- เปรียบเทียบกิจกรรมระหว่างช่วงเวลาต่าง ๆ ใช้ดูว่า: ช่วงเวลาลอนดอนคึกคักกว่านิวยอร์กหรือไม่? วันนี้มีความเคลื่อนไหวมากกว่าวานนี้หรือไม่? ช่วงแนวโน้มคึกคักกว่าช่วงรวมตัวหรือไม่?
- ผสมผสานกับโครงสร้างราคา ใช้แนวรับ/แนวต้าน จุดสวิง หรือ BOS/ChoCH ร่วมกับปริมาณ บริบทของราคาช่วยป้องกันสัญญาณเท็จจากการเพิ่มขึ้นของปริมาณที่มีเสียงรบกวน
- สังเกตกิจกรรมที่ระดับราคาสำคัญ เมื่อราคาทดสอบระดับสำคัญและปริมาณการเคลื่อนไหวราคาเพิ่มขึ้น หมายความว่ามีผู้ซื้อขายมากขึ้น ไม่ได้หมายความว่าผู้เล่นรายใหญ่มีส่วนร่วม
- อย่าสันนิษฐานว่ามันแสดงกิจกรรมของสถาบัน ปริมาณการเคลื่อนไหวราคาไม่สามารถแสดงการสะสม คำสั่งขนาดใหญ่ หรือ "เงินฉลาด" ใช้เพียงเพื่อวัดจังหวะและความเร็วเท่านั้น
__________________________________________________________________________________________
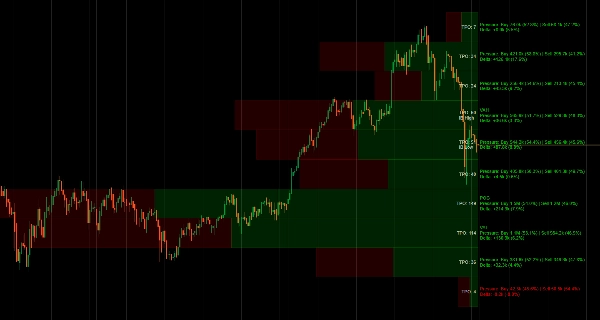
แสดงการแจกแจงปริมาณและเวลาที่ใช้ที่ราคาโดยใช้การติดตาม POC, Value Area และ Market Profile TPO
ตัวชี้วัดนี้แสดงการแจกแจงปริมาณโดยใช้แนวคิด Market Profile แสดงจุดควบคุม (ระดับกิจกรรมการเคลื่อนไหวราคาสูงสุด), ขอบเขต Value Area (พื้นที่ที่มีการซื้อขายมากที่สุด), ลำดับตัวอักษร TPO (เวลาที่ใช้ที่แต่ละราคา) และการแสดงผลเดลต้าแยกกิจกรรมการเคลื่อนไหวราคาตามทิศทางแท่งเทียน
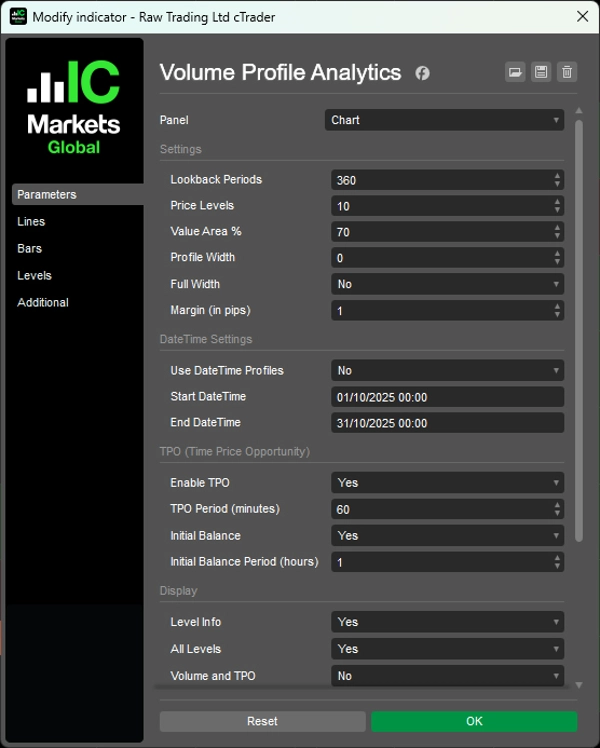
คุณสามารถเลือกช่วงเวลาย้อนหลังหรือกำหนดช่วงวันที่เฉพาะ แสดงแท่งปริมาณเป็นสัดส่วนหรือเต็มความกว้าง สลับระหว่างทุกระดับหรือเฉพาะระดับสำคัญ และปรับแต่งสีสำหรับกิจกรรมกระทิง/หมี
คุณสมบัติ
การวิเคราะห์การแจกแจงปริมาณ
- จุดควบคุม (POC): ระดับราคาที่มีกิจกรรมสูงสุด—ที่ราคานั้นใช้เวลามากที่สุด
- Value Area (VA): โซนความเข้มข้นของกิจกรรมที่ปรับแต่งได้ (ค่าเริ่มต้น 70%)—ที่มีการซื้อขายมากที่สุด
- VAH/VAL: ขอบเขต Value Area สูง/ต่ำ—ระดับแนวรับ/แนวต้านที่เป็นไปได้
- การแสดงผลเดลต้า: แท่งแยกแสดงทิศทางแท่งเทียนที่แต่ละระดับราคา
Market Profile TPO
- การติดตาม Time Price Opportunity: นับจำนวนช่วงเวลาที่ซื้อขายที่แต่ละราคา
- ตัวอักษร TPO: การแสดงภาพเวลาที่ใช้ที่ราคา (ลำดับ A-Z)
- Initial Balance (IB): ช่วงเวลาหนึ่งชั่วโมงแรก—สำคัญสำหรับโครงสร้างการเทรดรายวัน
- เครื่องหมาย IB สูง/ต่ำ: ขอบเขตช่วงเปิด
ตัวเลือกการย้อนกลับที่ยืดหยุ่น
- ตามช่วงเวลา: กำหนดจำนวนแท่งเทียนที่จะวิเคราะห์ (เช่น 120 แท่งล่าสุด)
- ช่วงวันที่และเวลา: กำหนดโปรไฟล์ระหว่างวันที่/เวลาที่เฉพาะเจาะจงสำหรับการวิเคราะห์เหตุการณ์
- ความกว้างแบบไดนามิก: โปรไฟล์ปรับขนาดอัตโนมัติหรือความกว้างคงที่
ตัวเลือกการแสดงผล
- แท่งปริมาณ: ความกว้างตามสัดส่วน (ปรับตามกิจกรรม) หรือแท่งความกว้างเต็มแบบสม่ำเสมอ
- แยกทิศทางแท่งเทียนภายในแต่ละแท่ง
- การคำนวณเดลต้าพร้อมเปอร์เซ็นต์
- สลับแสดงทุกระดับหรือเฉพาะระดับสำคัญ (POC, VAH, VAL)
- ควบคุมการมองเห็นรายละเอียด Volume/TPO
- การแยกทิศทางพร้อมเปอร์เซ็นต์
- ปรับขนาดตัวอักษรและระยะขอบตาม pip
การปรับแต่งสี
- สีแยกอิสระสำหรับแท่งทิศทางกระทิง/หมี
- สีข้อความแยกสำหรับเดลต้าบวก/ลบ
- สีข้อความเฉพาะสำหรับ TPO
ประสิทธิภาพที่ได้รับการปรับปรุง
- แคชการค้นหาช่วงเวลาและการวาดรูปสี่เหลี่ยมอย่างมีประสิทธิภาพ
- การคำนวณซ้ำขั้นต่ำเพื่อประสิทธิภาพที่ราบรื่น
- การคำนวณเดลต้าระดับมืออาชีพโดยอิงจากโครงสร้างแท่งเทียน
__________________________________________________________________________________________
ตัวชี้วัดฟรีเพิ่มเติม
สำรวจเครื่องมือวิเคราะห์ตลาดหลากหลายประเภท — ตั้งแต่โครงสร้างและปริมาณไปจนถึงการถดถอย ความผันผวน และกรอบเวลาที่กำหนดเอง
ซอร์สโค้ดมีให้บน GitHub ที่เก็บข้อมูล.
ทั้งหมดใช้ฟรี แต่ถ้าคุณต้องการสนับสนุนด้วยกาแฟ คุณสามารถส่งได้ ที่นี่.
แนวรับ/แนวต้าน
ปริมาณ
- โปรไฟล์กิจกรรมปริมาณ
- ตัววิเคราะห์ประสิทธิภาพปริมาณ
- การวิเคราะห์โปรไฟล์ปริมาณ
- โปรไฟล์ปริมาณ - อัปเดต
- การวิเคราะห์การกระจายปริมาณ
- VWAP (ราคาถ่วงน้ำหนักด้วยปริมาณ)
ค่าเฉลี่ยเคลื่อนที่
- ค่าเฉลี่ยเคลื่อนที่ยึดจุด
- ค่าเฉลี่ยเคลื่อนที่ปรับตามส่วนเบี่ยงเบน
- เส้นแนวโน้มทันที
- ค่าเฉลี่ยเคลื่อนที่แบบปรับตัว Kaufman พร้อม Trend Vision
- ช่องค่าเฉลี่ยเคลื่อนที่
- ชุดค่าเฉลี่ยเคลื่อนที่
- ค่าเฉลี่ยเคลื่อนที่ช่องแนวโน้ม
ยูทิลิตี้/กำหนดเอง
แบบถดถอย
ความผันผวน
ออสซิลเลเตอร์
__________________________________________________________________________________________
ข้อจำกัดความรับผิดชอบ
การเทรดมีความเสี่ยง ตัวชี้วัดนี้มีไว้สำหรับการวิเคราะห์ทางเทคนิคเท่านั้น — โปรดใช้การบริหารความเสี่ยงอย่างเหมาะสมและเทรดอย่างรับผิดชอบเสมอ
คำติชม & การปรับปรุง
หากคุณมีข้อเสนอแนะ คำขอคุณสมบัติ หรือไอเดียสำหรับการปรับปรุง โปรดแสดงความคิดเห็นในแท็บอภิปราย คำติชมของคุณช่วยปรับปรุงตัวชี้วัดสำหรับทุกคน
สรุป
Users can customize lookback periods by number of bars or specific date/time ranges and choose between proportional or full-width volume bars. The indicator also provides delta visualization, splitting tick activity by candle direction with percentage breakdowns, and offers extensive display and color customization options for bullish and bearish activity.
This tool is optimized for performance with cached calculations and efficient drawing methods. It is designed to measure market activity rhythm and tempo based on tick volume, which counts price changes but does not represent actual traded money or liquidity. It is suitable for analyzing volume distribution and market structure across various trading sessions and timeframes.
รีวิวจากลูกค้า
5 | 100 % | |
4 | 0 % | |
3 | 0 % | |
2 | 0 % | |
1 | 0 % |


!["[Hamster-Coder] Pivot Points MTF" โลโก้](https://cdn.ctrader.com/image/webp/4c143e5a-309c-40e3-a578-f04d1e133ffa_31159)


!["High-Low Divergence [Iridio Capital]" โลโก้](https://cdn.ctrader.com/image/webp/443c4661-7abb-40f1-842f-4b6ec560649b_40914)
