
설명
Sero — 모멘텀 오실레이터
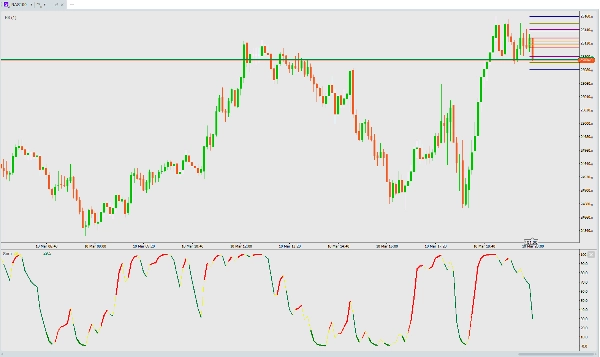
Sero는 시장 모멘텀 변화를 명확하고 색상으로 구분된 시각적 신호로 제공하는 확률 기반 모멘텀 오실레이터입니다.
작동 원리
Sero는 15봉 범위 내에서 전형 가격(고가+저가+종가)/3의 평활 확률 값을 계산한 후, 빠른 2기간 EMA를 적용하여 반응성이 뛰어난 0–100 오실레이터를 생성합니다.
주목할 점
색상이 의미를 전달합니다:
- 노란색 선 — 기본 Sero 값(항상 표시됨)
- 빨간색 선 — 강세 모멘텀(Sero가 상승 중)
- 굵은 빨간색 선 — 강한 강세 모멘텀(상승 + 20 이상 — 과매도 구간에서 돌파 확인)
- 초록색 선 — 약세 모멘텀(Sero가 하락 중)
- 굵은 초록색 선 — 강한 약세 급락(하락 + 20 이하 — 과매도 구간 깊숙이)
주요 신호:
- 매수 신호 — 색상이 초록에서 빨강으로 전환, 특히 20 이하에서(과매도 반전)
- 매도 신호 — 색상이 빨강에서 초록으로 전환, 특히 80 이상에서(과매수 반전)
- 강한 추세 — 굵은 선이 모멘텀 확신을 확인
- 소진 — 20 이하의 굵은 초록색 = 매도세가 약해질 수 있으니 반전을 주시
최선의 활용법
- 모든 타임프레임 및 모든 종목
- 확인을 위해 가격 움직임 또는 지지/저항 수준과 결합
- 극한(0 또는 100) 근처의 색상 전환이 가장 높은 확률의 신호
- 설정 불필요 — 최적화되어 바로 사용 가능
요약
AI 요약
Sero is a stochastic-based momentum oscillator designed to identify market momentum shifts through clear, color-coded visual signals. It calculates a smoothed stochastic value from the Typical Price [(High + Low + Close) / 3] over a 15-bar range, then applies a fast 2-period exponential moving average (EMA) to generate a responsive oscillator ranging from 0 to 100.
The indicator displays multiple colored lines to represent momentum states:
- Yellow line: base Sero value (always visible)
- Red line: bullish momentum (rising oscillator)
- Thick red line: strong bullish momentum (rising and above 20, indicating breakout from oversold)
- Green line: bearish momentum (falling oscillator)
- Thick green line: strong bearish momentum (falling and below 20, indicating deep oversold conditions)
Key signals include buy signals when the color flips from green to red, especially below 20 (oversold reversal), and sell signals when it flips from red to green, especially above 80 (overbought reversal). Thick lines confirm strong momentum trends, while thick green lines below 20 may indicate exhaustion of selling pressure and potential reversal.
Sero works on any timeframe and instrument without requiring user settings, and it is recommended to combine it with price action or support/resistance levels for confirmation. Color transitions near extremes (0 or 100) provide the highest-probability signals.
지표 프로필
고객 리뷰
0.0
리뷰: 0
고객 리뷰
이 상품에 대한 리뷰가 아직 없습니다. 이미 사용해 보셨나요? 다른 사람들에게 가장 먼저 소개해 주세요!
상담
자주 묻는 질문(FAQ)
BTCUSD
Forex
Signal
Indices
EURUSD
Commodities
GBPUSD
NZDUSD
Crypto
Stocks
XAUUSD
NAS100
USDJPY
트레이딩 봇, 지표, 플러그인 등 cTrader Store에서 제공되는 상품은 제3자 개발자에 의해 제공되며, 이는 단순히 정보 및 기술적 접근을 목적으로 제공된 것입니다. cTrader Store는 중개인이 아니며, 투자 조언, 개인별 추천 또는 향후 성과에 대한 어떠한 보장도 제공하지 않습니다.
이 작성자의 상품 더 보기


가격
가입일 10/03/2026
105
무료 설치