설명
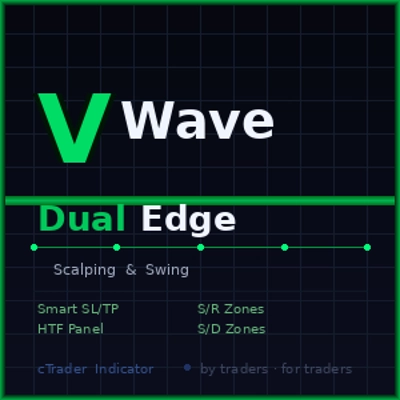
VWave Dual Edge — 이론이 아닌 실제 거래에서 만들어진
이 지표를 판매하려고 만든 것이 아닙니다. 제가 필요해서 만든 것입니다.
스캘핑과 스윙 타임프레임에서 라이브 차트를 수개월간 테스트하고, 손실을 보고, 조정하고, 다듬은 끝에 저는 실제로 신뢰할 수 있는 무언가를 얻었습니다. 그때서야 공유하기로 결정했습니다.
VWave Dual Edge가 하는 일:
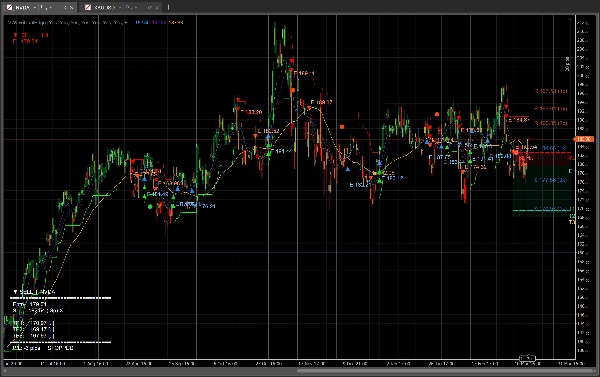
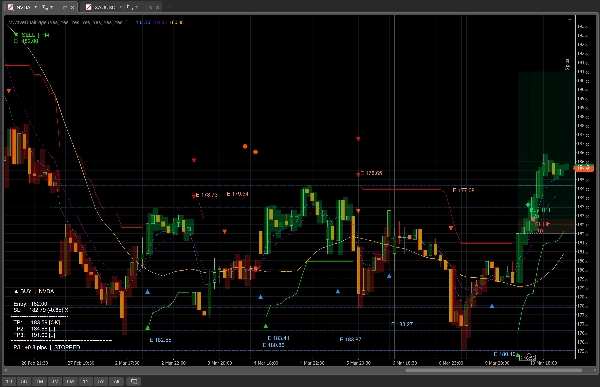
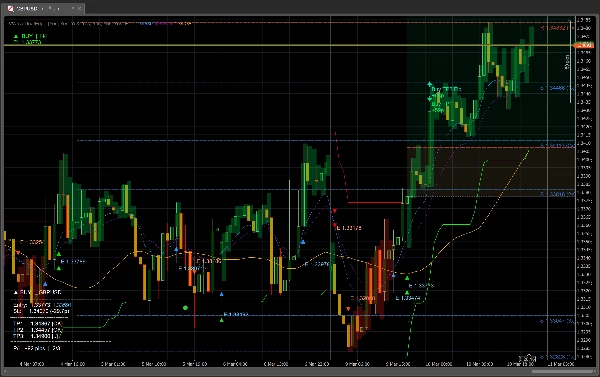
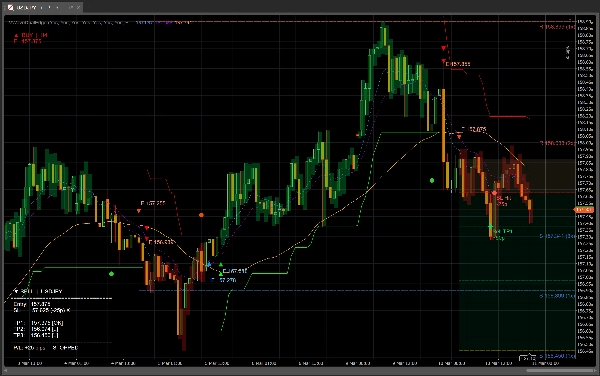
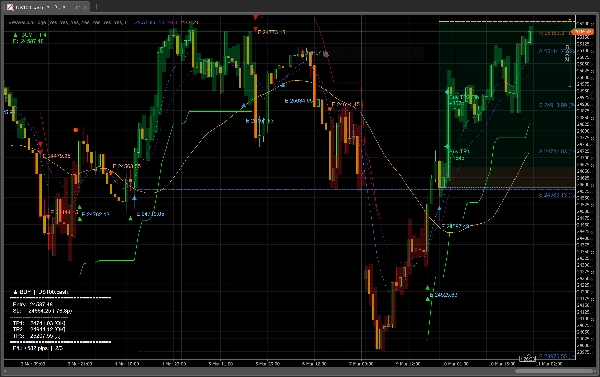
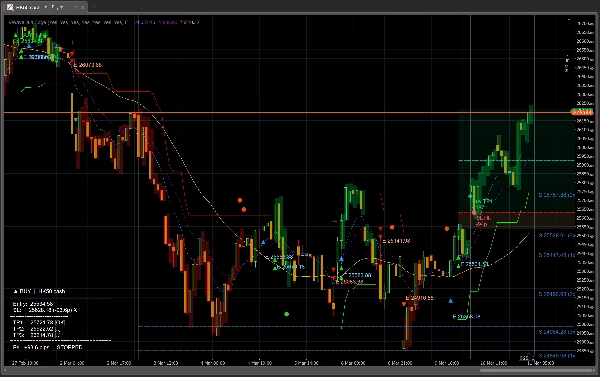
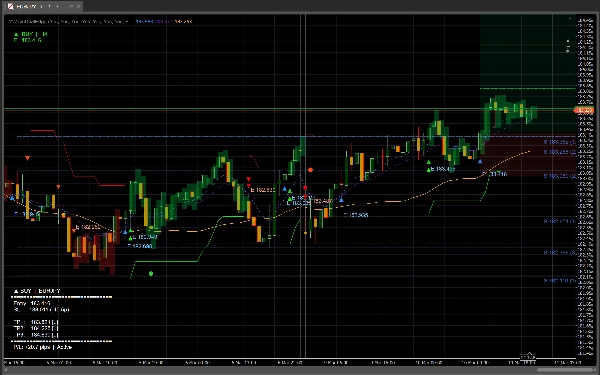
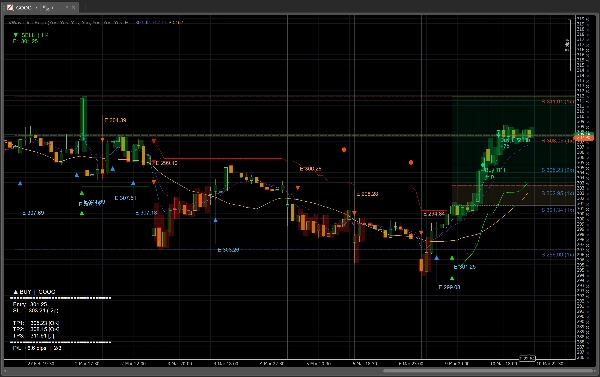
VWave Dual Edge는 모든 타임프레임과 모든 종목에서 작동하는 완전한 거래 보조 도구입니다. 추세 방향, 진입 신호, 스마트 리스크 관리, 주요 가격 수준을 하나의 깔끔한 오버레이에 결합했습니다.
핵심 기능:
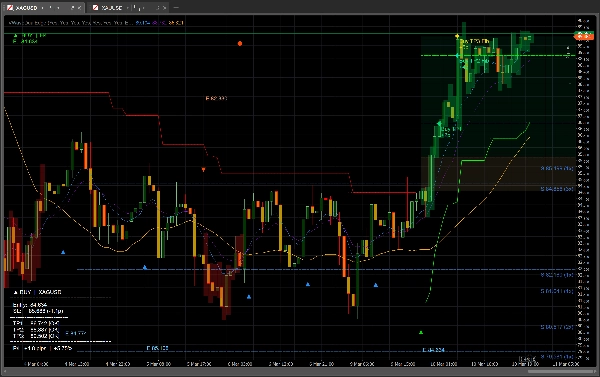
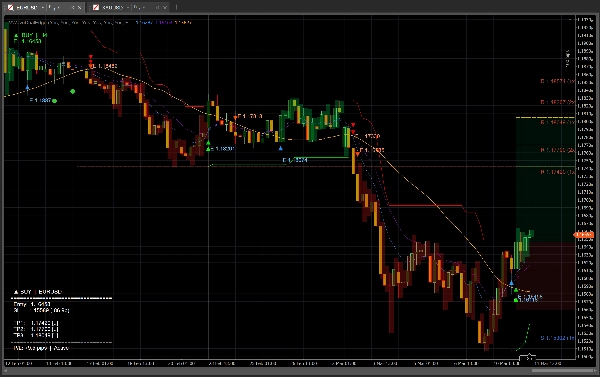
— 타임프레임별 자동 조정이 가능한 트리플 MA 시스템 — 추세 확인을 위한 SuperTrend 필터 — 과매수/과매도 함정을 피하기 위한 RSI 필터 — 스마트 스톱 로스: ATR 기반 또는 고정 핍 — 갭 스마트 SL: 가격 갭을 감지하고 자동 조정 — 세 가지 이익 실현 목표: 스마트 S/R, 리스크:보상, 또는 ATR 기반 — 각 목표 달성 후 피보나치 TP 재계산 — 프랙탈에서 자동 감지되는 지지 및 저항 수준 — 통합 돌파에서 자동 감지되는 공급 및 수요 구역 — HTF 패널: 상위 타임프레임 편향을 한눈에 확인 — 재진입 시스템: TP1 이후 되돌림 진입 포착 — 전체 정보 패널: 진입, SL, TP1/2/3, 손익 — 차트에 실시간 표시
대상 사용자:
— 빠르고 명확한 신호가 필요한 스캘퍼 — 구조, 수준, 인내가 필요한 스윙 트레이더 — 5가지 다른 지표를 번갈아 사용하는 데 지친 모든 사람
솔직한 메모:
이 지표가 모든 거래를 승리로 만들지는 않습니다 — 그런 것은 없습니다. 대신 논리가 아닌 감정에 기반한 결정을 피할 수 있도록 구조적이고 반복 가능한 프레임워크를 제공합니다. 저도 매 세션마다 직접 사용합니다.
선별된 백테스트도, 비현실적인 결과도 없습니다. 단지 트레이더가 트레이더를 위해 만든 도구일 뿐입니다.
요약
고객 리뷰
5 | 50 % | |
4 | 50 % | |
3 | 0 % | |
2 | 0 % | |
1 | 0 % |