
설명
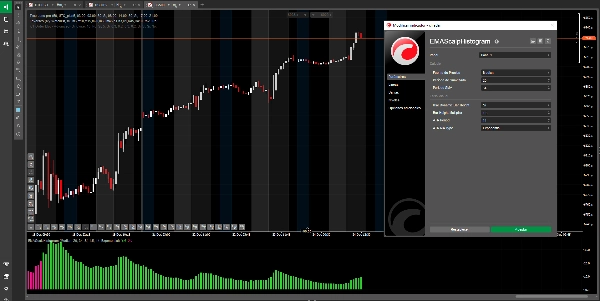
EMAScalpHistogram: 거래 관리용 모멘텀 시각화
EMAScalpHistogram이란?
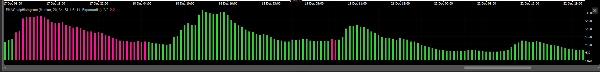
EMAScalpHistogram은 시장 모멘텀의 복잡성을 직관적이고 시각적으로 매력적인 히스토그램으로 변환하는 고급 기술 분석 도구입니다. 이 디자인은 한눈에 추세의 강도와 방향을 식별할 수 있도록 합니다.
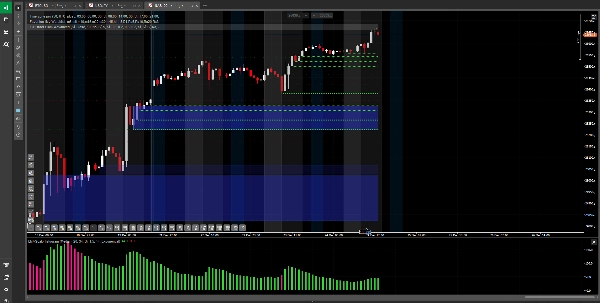
- 녹색 막대 (강세): 강한 매수 모멘텀을 나타내며, 매수자가 시장을 장악하고 있음을 시사합니다.
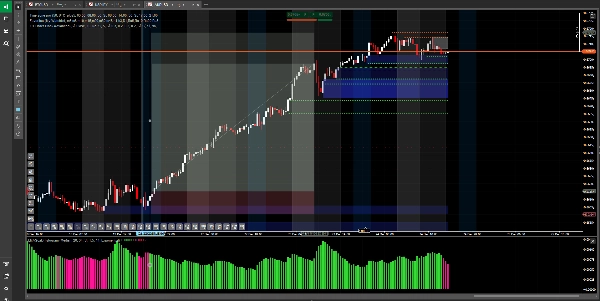
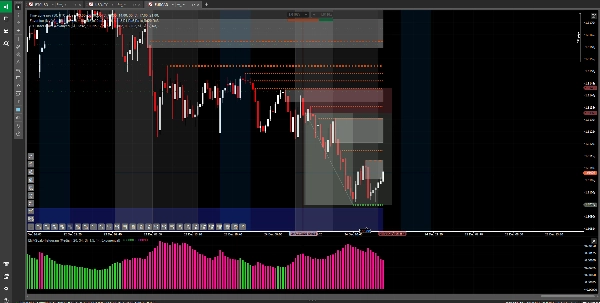
- 분홍색 막대 (약세): 강한 매도 모멘텀을 나타내며, 매도자가 가격 움직임을 지배하고 있음을 시사합니다.
- 동적 높이: 막대의 높이는 고정되어 있지 않고 시장 변동성에 맞춰 조정됩니다. 더 높은 막대는 더 강하고 확신 있는 움직임을 신호하며, 더 낮은 막대는 일시 중지 또는 약화된 추세를 나타냅니다.
주요 용도 및 권장 전략
EMAScalpHistogram은 최고급 거래 관리 도구로, 더 큰 자신감을 가지고 포지션을 유지하여 수익을 극대화하려는 트레이더를 위해 설계되었습니다. 가장 큰 가치는 이미 거래 중일 때 수익을 유지하고 증대하는 데 도움을 주는 것에 있습니다.
- 추세 확인: 가장 강력한 기능은 이미 식별한 추세의 강도를 검증하는 것입니다. 만약 롱 포지션에 있고 히스토그램이 지속적으로 녹색 막대를 보여준다면, 이는 매수 모멘텀이 유지되고 있음을 시각적으로 확인하는 것입니다.
- 거래 관리 (수익 유지 및 증대):
-
- 포지션 유지: 이것이 가장 가치 있는 적용입니다. 언제 포지션을 자신 있게 유지할지 결정하는 데 사용하세요. 히스토그램이 계속해서 유리한 막대를 보여준다면, 이는 작은 시장 변동으로 인해 수익성 있는 거래를 조기에 종료하지 않도록 하는 규율을 제공합니다.
- 수익 증대: 강한 모멘텀 단계 전체에 걸쳐 포지션을 유지하도록 도와줌으로써 더 큰 움직임을 포착하고 수익 잠재력을 증대할 수 있습니다.
- 모멘텀 약화 경고: 히스토그램 색상이 변경될 때(녹색에서 분홍색 또는 그 반대) 이는 모멘텀이 소진되고 있음을 알리는 첫 번째 경고 중 하나로, 수익을 확보하거나 종료 전략을 조정할 좋은 시기일 수 있음을 시사합니다.
피해야 할 점
진입 신호 아님: 중요한 점은 EMAScalpHistogram이 새로운 거래를 개시하기 위한 단독 신호로 사용되도록 설계되지 않았다는 것입니다. 이미 진행 중인 움직임의 강도를 확인하는 지표로서, 진입 신호로 사용하면 늦은 거래와 높은 위험, 제한된 수익 가능성이 발생할 수 있습니다.
위험 경고 및 면책 조항
이 지표의 사용은 사용자 본인의 책임과 위험 부담 하에 이루어집니다. 금융 상품 거래는 높은 위험을 수반하며 모든 투자자에게 적합하지 않을 수 있습니다. 이 도구는 투자 권유나 재정 조언을 구성하지 않습니다. 과거 성과가 미래 결과를 보장하지 않습니다. 실제 자본을 위험에 노출하기 전에 데모 계정에서 전략을 테스트할 것을 강력히 권장합니다.
요약
지표 프로필
고객 리뷰
4.6
리뷰: 3
5 | 67 % | |
4 | 33 % | |
3 | 0 % | |
2 | 0 % | |
1 | 0 % |
고객 리뷰
January 6, 2026
The entry stops feeling automatic, but the trade still needs a calm entry.
December 31, 2025
상담
자주 묻는 질문(FAQ)
Forex
Indices
Commodities
Crypto
Stocks
트레이딩 봇, 지표, 플러그인 등 cTrader Store에서 제공되는 상품은 제3자 개발자에 의해 제공되며, 이는 단순히 정보 및 기술적 접근을 목적으로 제공된 것입니다. cTrader Store는 중개인이 아니며, 투자 조언, 개인별 추천 또는 향후 성과에 대한 어떠한 보장도 제공하지 않습니다.


가격
가입일 24/02/2025
15
판매
1.82K
무료 설치