
Descripción
SMARTRSI CLOUD SYSTEM - Herramienta Avanzada de Análisis de Momentum
Transforma tu análisis RSI con este indicador revolucionario que combina la tecnología de suavizado Heikin Ashi con RSI centrado en cero para señales de momentum cristalinas. A diferencia de los indicadores RSI tradicionales que pueden ser ruidosos y difíciles de interpretar, SmartRSI Cloud System filtra el ruido del mercado y resalta el verdadero momentum direccional.
CARACTERÍSTICAS PRINCIPALES:
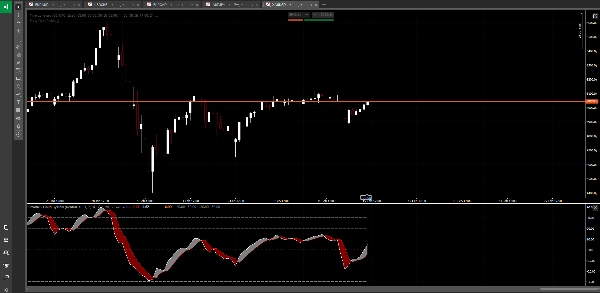
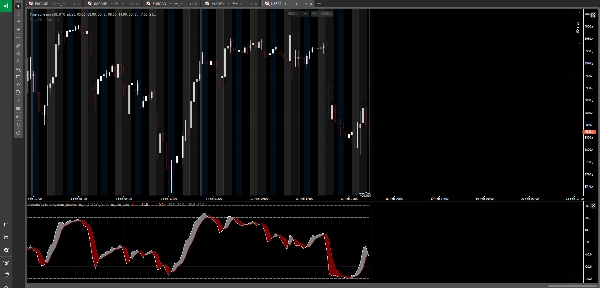
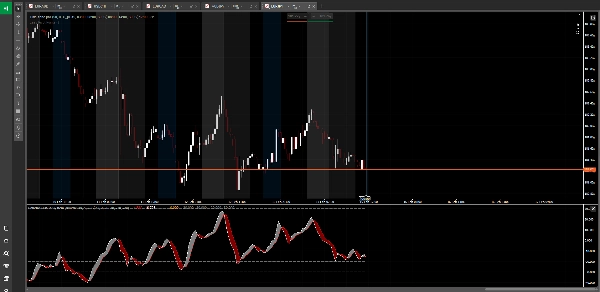
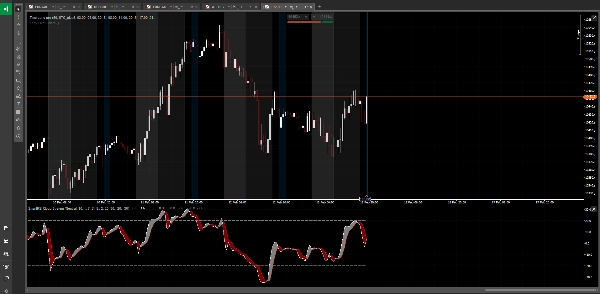
☁️ Nube Heikin Ashi RSI
Experimenta un análisis de momentum suavizado con formaciones visuales de nube. La nube te muestra instantáneamente la fuerza y dirección del momentum del mercado, haciendo que la identificación de tendencias sea sencilla.
⚖️ RSI Centrado en Cero
Observa el momentum tal como es - centrado en cero para un sesgo alcista/bajista claro. Los valores positivos indican fuerza de compradores, los valores negativos muestran presión de vendedores. No más suposiciones sobre si el RSI está subiendo o bajando.
🎯 Tecnología de Suavizado Inteligente
Elimina señales falsas con un suavizado inteligente del RSI. El indicador aplica principios Heikin Ashi a los cálculos del RSI, reduciendo drásticamente los falsos cambios mientras mantiene la precisión de la señal.
🔄 Modos Adaptativos para el Trader
Cambia entre tres modos de trading:
• Modo Neutral - Ver todas las señales
• Modo Compradores - Filtrar solo oportunidades largas
• Modo Vendedores - Filtrar solo oportunidades cortas
📊 Zonas de Sobrecompra/Sobreventa Multi-Nivel
Cuatro niveles distintos te ayudan a medir los extremos de momentum:
• Niveles estándar OB/OS para advertencias iniciales
• Niveles extremos OB/OS para zonas de reversión
• Totalmente personalizable para adaptarse a tu estilo de trading
🎨 Visualización Profesional
Pantalla limpia e intuitiva con:
• Formaciones de nube codificadas por colores
• Línea de gráfico RSI opcional con colores personalizables
• Niveles de límite claros
• Referencia de línea cero para reconocimiento instantáneo del sesgo
⚙️ Totalmente Personalizable
Ajusta cada aspecto:
• Longitud HARSI y parámetros de suavizado
• Periodo de cálculo del RSI
• Niveles de sobrecompra/sobreventa
• Elementos visuales y colores
• Preferencias de modo de trader
PERFECTO PARA:
• Identificar tendencias de momentum fuertes
• Detectar divergencias entre precio y momentum
• Cronometrar entradas en condiciones de sobrecompra/sobreventa
• Filtrar operaciones basadas en el sesgo del mercado
• Confirmar rupturas y continuaciones de tendencia
• Análisis de momentum en múltiples marcos temporales
LO QUE LO HACE DIFERENTE:
Los indicadores RSI tradicionales te muestran datos de momentum en bruto que pueden ser erráticos y engañosos. SmartRSI Cloud System aplica un suavizado de nivel institucional mientras mantiene la integridad de la señal. El enfoque centrado en cero elimina la confusión sobre la dirección del momentum, y la visualización en nube hace que los patrones complejos de momentum sean instantáneamente reconocibles.
Ya sea que hagas scalping, day trading o swing trading, esta herramienta te brinda claridad sobre el momentum del mercado que los indicadores estándar simplemente no pueden proporcionar.
---
⚠️ AVISO DE RIESGO:
Operar con divisas extranjeras, criptomonedas y otros instrumentos financieros conlleva un alto nivel de riesgo y puede no ser adecuado para todos los inversores. El alto grado de apalancamiento puede actuar en tu contra así como a tu favor. Antes de decidir operar, debes considerar cuidadosamente tus objetivos de inversión, nivel de experiencia y apetito por el riesgo. Existe la posibilidad de que puedas sufrir una pérdida de parte o la totalidad de tu inversión. Por lo tanto, no debes invertir dinero que no puedas permitirte perder. Debes estar consciente de todos los riesgos asociados con el trading y buscar asesoramiento de un asesor financiero independiente si tienes alguna duda. El rendimiento pasado no es indicativo de resultados futuros.
Resumen
Valoraciones de clientes
5 | 100 % | |
4 | 0 % | |
3 | 0 % | |
2 | 0 % | |
1 | 0 % |


![Logotipo de "[Hamster-Coder] Pivot Points MTF"](https://cdn.ctrader.com/image/webp/4c143e5a-309c-40e3-a578-f04d1e133ffa_31159)


