Deskripsi
Rata-rata Harian Fibonacci - Level Fibonacci Harian Otomatis
Memproyeksikan rentang harian rata-rata dalam level Fibonacci dari pembukaan hari
Apa yang dilakukan indikator ini?
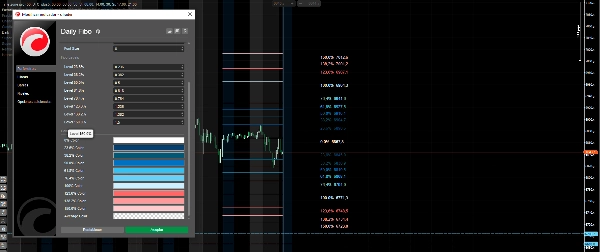
Rata-rata Harian Fibonacci secara otomatis menggambar level Fibonacci berdasarkan rentang harian rata-rata. Setiap hari, indikator memproyeksikan level kunci baik ke atas maupun ke bawah dari harga pembukaan, membantu Anda mengidentifikasi target potensial dan zona pembalikan.
Fitur Utama
✅ Pembaruan harian otomatis - Level secara otomatis digambar ulang setiap hari ✅ Level yang dapat disesuaikan - Konfigurasikan hingga 8 level Fibonacci berbeda ✅ Warna khusus - Setiap level memiliki warna yang dapat dikenali sendiri ✅ Label dengan harga - Menampilkan persentase dan harga tepat dari setiap level ✅ Rata-rata hari yang dapat disesuaikan - Pilih berapa hari yang digunakan untuk perhitungan rata-rata (default 20)
Level Default yang Termasuk
- 0% - Pembukaan hari (garis dasar)
- 23,6%, 38,2%, 50%, 61,8%, 76,4% - Retracement dan ekstensi internal
- 100% - Rentang rata-rata lengkap
- 123,6%, 138,2%, 150% - Ekstensi eksternal
Cara Menggunakan Indikator
- Identifikasi arah - Harga pembukaan (0%) adalah titik referensi Anda
- Cari target bullish - Level atas menandai tujuan beli
- Cari target bearish - Level bawah menandai tujuan jual
- Zona pembalikan - Ketika harga mencapai level ekstrem (100%+), cari kemungkinan pembalikan
Parameter yang Dapat Disesuaikan
- Hari untuk perhitungan rata-rata
- Level Fibonacci khusus
- Warna individual per level
- Tampilkan/sembunyikan label dan harga
- Ukuran font
Sempurna untuk trader yang mencari target yang jelas dan zona harga yang mungkin selama sesi perdagangan.
Ringkasan
Ulasan pelanggan
5 | 50 % | |
4 | 50 % | |
3 | 0 % | |
2 | 0 % | |
1 | 0 % |