
Descripción
EMAScalpHistogram: Visualización del Momentum para la Gestión de Operaciones
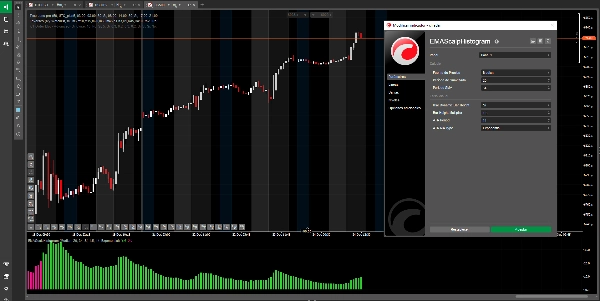
¿Qué es EMAScalpHistogram?
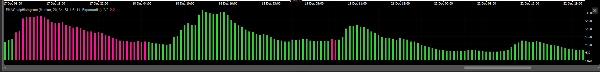
EMAScalpHistogram es una herramienta avanzada de análisis técnico que transforma la complejidad del momentum del mercado en un histograma intuitivo y visualmente atractivo. Su diseño permite identificar la fuerza y dirección de la tendencia de un solo vistazo.
- Barras Verdes (Alcistas): Indican un fuerte momentum de compra, sugiriendo que los compradores controlan el mercado.
- Barras Rosadas (Bajistas): Indican un fuerte momentum de venta, sugiriendo que los vendedores dominan la acción del precio.
- Altura Dinámica: La altura de las barras no es fija; se adapta a la volatilidad del mercado. Barras más altas señalan movimientos con mayor fuerza y convicción, mientras que barras más cortas indican una pausa o una tendencia debilitada.
Uso Principal y Estrategia Recomendada
EMAScalpHistogram es una herramienta de gestión de operaciones de élite, diseñada para traders que buscan maximizar ganancias manteniendo posiciones con mayor confianza. Su mayor valor radica en ayudarte a mantener y amplificar tus ganancias una vez que ya estás en una operación.
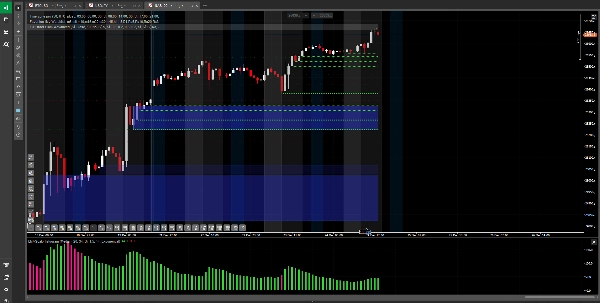
- Confirmación de Tendencia: Su función más poderosa es validar la fuerza de una tendencia que ya has identificado. Si estás en una posición larga y el histograma muestra consistentemente barras verdes, es una confirmación visual de que el momentum de compra permanece intacto.
- Gestión de Operaciones (Mantener y Amplificar Ganancias):
-
- Para Mantener Posiciones: Esta es su aplicación más valiosa. Úsalo para decidir cuándo mantener una posición con confianza. Si el histograma continúa mostrando barras a tu favor, te da la disciplina para no cerrar una operación rentable prematuramente debido a fluctuaciones menores del mercado.
- Para Amplificar Ganancias: Al ayudarte a mantener la posición durante toda la fase de momentum fuerte, te permite capturar movimientos más grandes y amplificar tu potencial de ganancia.
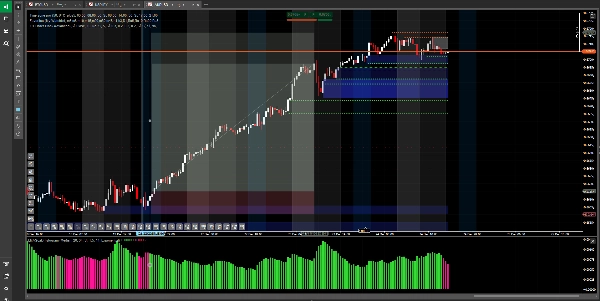
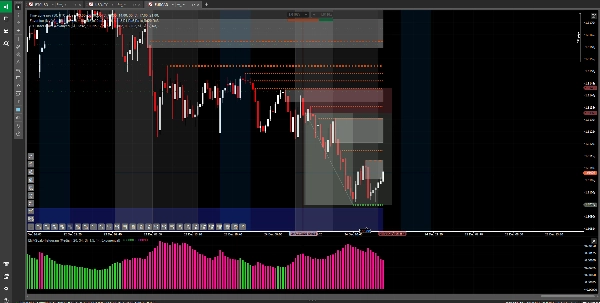
- Alerta de Momentum Débil: Un cambio en el color del histograma (de verde a rosado o viceversa) es una de las primeras alertas de que el momentum se está agotando, sugiriendo que podría ser un buen momento para asegurar ganancias o ajustar tu estrategia de salida.
Qué Evitar
No es una Señal de Entrada: Críticamente, EMAScalpHistogram no está diseñado para usarse como una señal independiente para abrir nuevas operaciones. Como un indicador que confirma la fuerza de un movimiento ya en curso, usarlo para entrada puede resultar en operaciones tardías con alto riesgo y potencial de ganancia limitado.
Advertencia de Riesgo y Descargo de Responsabilidad
El uso de este indicador es bajo tu propio riesgo y responsabilidad. Operar con instrumentos financieros conlleva un alto nivel de riesgo y puede no ser adecuado para todos los inversores. Esta herramienta no constituye una recomendación de inversión ni asesoramiento financiero. El rendimiento pasado no garantiza resultados futuros. Se recomienda encarecidamente probar cualquier estrategia en una cuenta demo antes de arriesgar capital real.
Resumen
Valoraciones de clientes
5 | 67 % | |
4 | 33 % | |
3 | 0 % | |
2 | 0 % | |
1 | 0 % |


