
説明
SMARTRSI CLOUD SYSTEM - 高度なモメンタム分析ツール
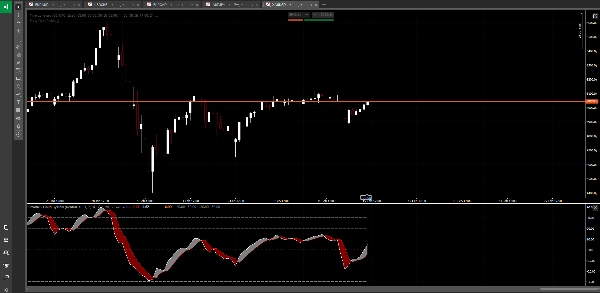
ヘイキンアシの平滑化技術とゼロ中心のRSIを組み合わせたこの革新的なインジケーターで、RSI分析を変革しましょう。従来のRSIインジケーターはノイズが多く解釈が難しいことがありますが、SmartRSI Cloud Systemは市場のノイズを除去し、真の方向性モメンタムを強調します。
主な特徴:
☁️ ヘイキンアシRSIクラウド
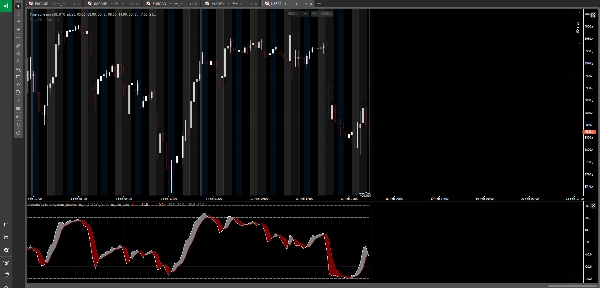
視覚的なクラウド形成による平滑化されたモメンタム分析を体験してください。クラウドは市場モメンタムの強さと方向を即座に示し、トレンドの識別を容易にします。
⚖️ ゼロ中心RSI
モメンタムをそのままに表示 - ゼロを中心にして強気/弱気のバイアスを明確にします。正の値は買い手の強さを示し、負の値は売り手の圧力を示します。RSIが上昇トレンドか下降トレンドかの推測はもう不要です。
🎯 スマート平滑化技術
インテリジェントなRSI平滑化で誤信号を排除します。インジケーターはRSI計算にヘイキンアシの原理を適用し、シグナルの正確性を保ちながらホイップソーを大幅に減少させます。
🔄 適応型トレーダーモード
3つの取引モードを切り替え可能:
• ニュートラルモード - すべてのシグナルを表示
• バイヤーズモード - ロングの機会のみをフィルタリング
• セラーズモード - ショートの機会のみをフィルタリング
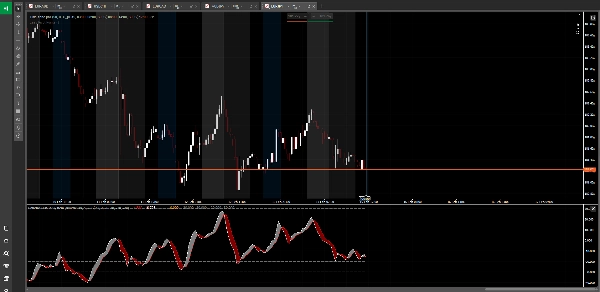
📊 多段階の買われ過ぎ/売られ過ぎゾーン
4つの異なるレベルでモメンタムの極端な状態を評価:
• 初期警告のための標準的なOB/OSレベル
• 反転ゾーンのための極端なOB/OSレベル
• あなたの取引スタイルに合わせて完全にカスタマイズ可能
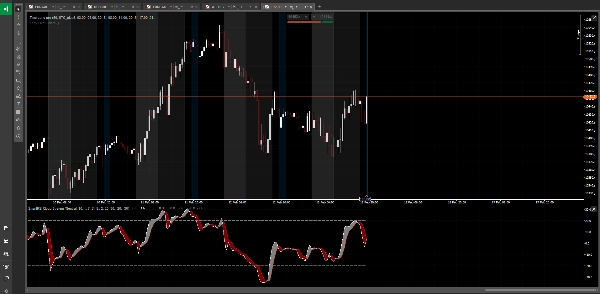
🎨 プロフェッショナルな視覚化
クリーンで直感的な表示:
• 色分けされたクラウド形成
• カスタマイズ可能な色のRSIプロットライン(オプション)
• 明確な境界レベル
• 即時のバイアス認識のためのゼロライン参照
⚙️ 完全カスタマイズ可能
あらゆる側面を調整可能:
• HARSIの長さと平滑化パラメータ
• RSI計算期間
• 買われ過ぎ/売られ過ぎレベル
• 視覚要素と色
• トレーダーモードの設定
最適な用途:
• 強力なモメンタムトレンドの特定
• 価格とモメンタムのダイバージェンスの発見
• 買われ過ぎ/売られ過ぎ状態でのエントリータイミング
• 市場バイアスに基づく取引のフィルタリング
• ブレイクアウトとトレンド継続の確認
• マルチタイムフレームのモメンタム分析
他と違う点:
従来のRSIインジケーターは、乱れやすく誤解を招く生のモメンタムデータを表示します。SmartRSI Cloud Systemは、信号の整合性を保ちながら機関レベルの平滑化を適用します。ゼロ中心のアプローチはモメンタムの方向に関する混乱を排除し、クラウドの視覚化により複雑なモメンタムパターンを即座に認識可能にします。
スキャルピング、デイトレード、スイングトレードのいずれであっても、このツールは標準的なインジケーターでは提供できない市場モメンタムの明確さを提供します。
---
⚠️ リスク免責事項:
外国為替、暗号通貨、その他の金融商品を取引することは高いリスクを伴い、すべての投資家に適しているわけではありません。高いレバレッジはあなたにとって有利にも不利にも働く可能性があります。取引を決定する前に、投資目的、経験レベル、リスク許容度を慎重に検討してください。投資の一部または全部を失う可能性があります。したがって、失っても問題ない資金で投資するべきではありません。取引に伴うすべてのリスクを認識し、疑問がある場合は独立した金融アドバイザーに相談してください。過去のパフォーマンスは将来の結果を保証するものではありません。
概要
カスタマーレビュー
5 | 100 % | |
4 | 0 % | |
3 | 0 % | |
2 | 0 % | |
1 | 0 % |


