
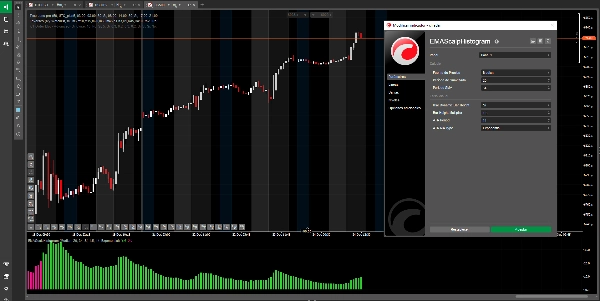
EMAScalpHistogram
インジケーター
バージョン 1.0、Dec 2025
Windows、Mac
4.6
レビュー: 3
説明
EMAScalpHistogram:トレード管理のためのモメンタム可視化
EMAScalpHistogramとは?
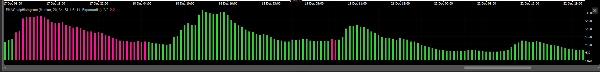
EMAScalpHistogramは、市場のモメンタムの複雑さを直感的で視覚的に魅力的なヒストグラムに変換する高度なテクニカル分析ツールです。その設計により、トレンドの強さと方向を一目で識別できます。
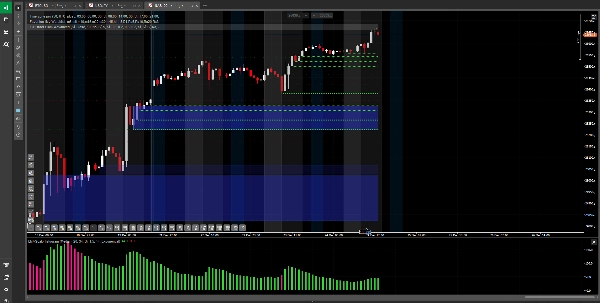
- 緑のバー(強気): 強い買いのモメンタムを示し、買い手が市場を支配していることを示唆します。
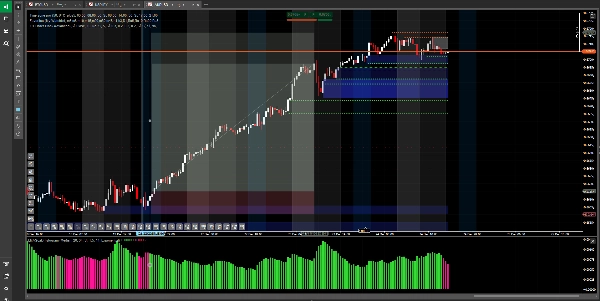
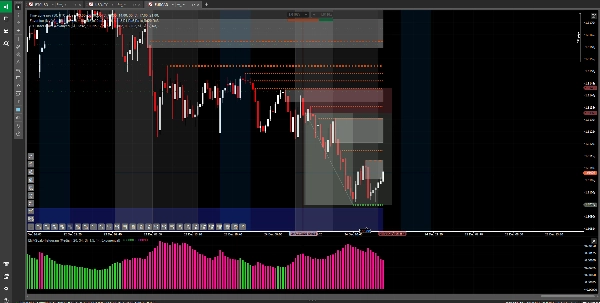
- ピンクのバー(弱気): 強い売りのモメンタムを示し、売り手が価格の動きを支配していることを示唆します。
- 動的な高さ: バーの高さは固定されておらず、市場のボラティリティに適応します。高いバーはより強く確信のある動きを示し、低いバーは一時停止またはトレンドの弱まりを示します。
主な用途と推奨戦略
EMAScalpHistogramはエリートトレード管理ツールであり、より自信を持ってポジションを保有することで利益を最大化しようとするトレーダー向けに設計されています。その最大の価値は、すでにトレード中の際に利益を維持し増幅するのを助けることにあります。
- トレンド確認: 最も強力な機能は、すでに特定したトレンドの強さを検証することです。ロングポジションにいる場合、ヒストグラムが一貫して緑のバーを示していれば、買いのモメンタムが維持されている視覚的な確認となります。
- トレード管理(利益の保持と増幅):
-
- ポジションを保持するために: これが最も価値のある用途です。自信を持っていつポジションを保持するかを判断するために使用してください。ヒストグラムが有利なバーを示し続ける場合、小さな市場変動によって利益のあるトレードを早期に閉じることを避ける規律を与えます。
- 利益を増幅するために: 強いモメンタムの全期間にわたってポジションを保持するのを助けることで、大きな動きを捉え、利益の可能性を増幅させます。
- モメンタムの弱まりの警告: ヒストグラムの色の変化(緑からピンク、またはその逆)は、モメンタムが消耗しつつある最初の警告の一つであり、利益確定や出口戦略の調整を検討する良いタイミングであることを示唆します。
避けるべきこと
エントリーシグナルではない: 重要なことに、EMAScalpHistogramは新しいトレードを開始するための単独のシグナルとして設計されていません。すでに進行中の動きの強さを確認する指標として、エントリーに使用すると遅れたトレードとなり、高リスクで利益の可能性が限定される結果となります。
リスク警告と免責事項
この指標の使用は自己責任で行ってください。金融商品の取引は高いリスクを伴い、すべての投資家に適しているわけではありません。このツールは投資推奨や金融アドバイスを構成するものではありません。過去のパフォーマンスは将来の結果を保証するものではありません。実際の資金をリスクにさらす前に、デモ口座で戦略をテストすることを強く推奨します。
概要
インジケーターのプロフィール
カスタマーレビュー
4.6
レビュー: 3
5 | 67 % | |
4 | 33 % | |
3 | 0 % | |
2 | 0 % | |
1 | 0 % |
カスタマーレビュー
January 6, 2026
The entry stops feeling automatic, but the trade still needs a calm entry.
December 31, 2025
ディスカッション
よくあるご質問
Forex
Indices
Commodities
Crypto
Stocks
cTrader Storeで入手可能な取引ボット、インジケーター、プラグインなどの商品は、第三者の開発者が提供するものであり、情報と技術の取得のみを目的としてご利用いただけます。cTrader Storeはブローカーではなく、投資助言や個人的な推奨を行うことも、将来のパフォーマンスを保証することもありません。


価格
登録日 24/02/2025
15
販売
1.82K
無料インストール