
RT Chandelier Exit
Chỉ báo
4 lượt mua
Phiên bản 1.0, Sep 2024
Windows, Mac
Mô tả
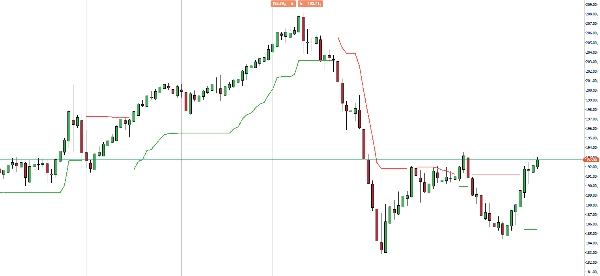
Giới thiệu chỉ báo Chandelier Exit, công cụ tối ưu để thoát giao dịch với độ chính xác và sự tự tin.
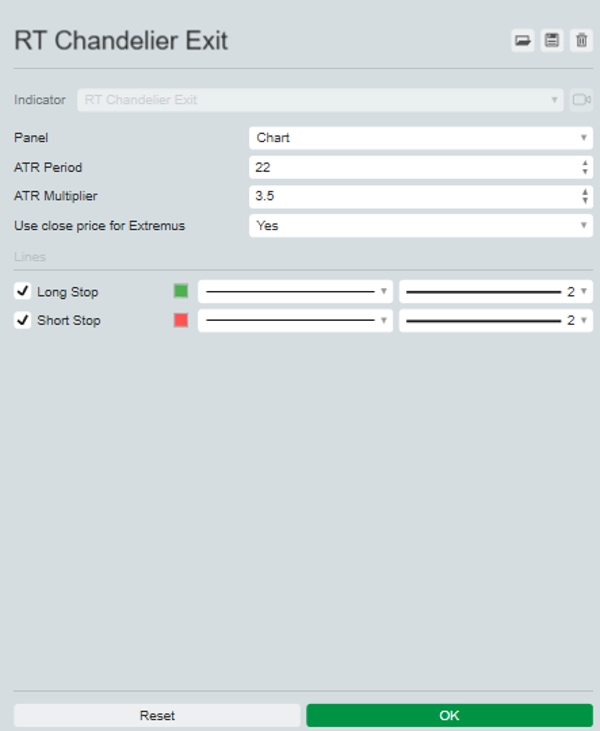
Chỉ báo này tính toán điểm dừng lỗ động dựa trên mức cao nhất và ATR, cung cấp các tín hiệu trực quan rõ ràng trên biểu đồ của bạn theo thời gian thực.
Được thiết kế để giúp bạn khóa lợi nhuận và bảo vệ khỏi các biến động ngược chiều thị trường, Chandelier Exit đảm bảo bạn luôn đi trước xu hướng.
Hoàn hảo cho các nhà giao dịch muốn nâng cao chiến lược với các tín hiệu thoát đáng tin cậy, chỉ báo này cung cấp cách tiếp cận trực quan, đơn giản để quản lý rủi ro. Nâng cấp bộ công cụ giao dịch của bạn và bảo vệ lợi nhuận với Chandelier Exit.
Tóm tắt
Tóm tắt AI
The RT Chandelier Exit indicator dynamically calculates stop-loss levels using the highest high and Average True Range (ATR) to provide real-time visual cues on trading charts. It is designed to help traders optimize trade exits by locking in profits and protecting against market reversals. This indicator supports various markets including Forex, cryptocurrencies, commodities, stocks, and indices, with symbols such as BTCUSD, EURUSD, GBPUSD, XAUUSD, NAS100, and USDJPY. It offers a straightforward, visual approach to risk management, making it suitable for traders seeking reliable exit signals to enhance their trading strategies.
Hồ sơ chỉ báo
Đánh giá của khách hàng
0.0
Đánh giá: 0
Đánh giá của khách hàng
Sản phẩm này chưa có đánh giá nào. Bạn đã dùng thử chưa? Hãy là người đầu tiên chia sẻ với mọi người!
Thảo luận
Câu hỏi thường gặp
BTCUSD
Forex
Signal
Indices
EURUSD
Commodities
GBPUSD
NZDUSD
Prop
Scalping
Crypto
Stocks
XAUUSD
NAS100
ATR
USDJPY
Các sản phẩm có sẵn trên cTrader Store, bao gồm bot giao dịch, chỉ báo và plugin, được cung cấp bởi các nhà phát triển bên thứ ba và chỉ nhằm mục đích cung cấp thông tin và tiếp cận kỹ thuật. cTrader Store không phải là nhà môi giới và không cung cấp lời khuyên đầu tư, khuyến nghị cá nhân hay bất kỳ đảm bảo nào về hiệu suất trong tương lai.


Giá
Kể từ 25/09/2024
20
Lượt bán