
ICT Order Block
Indicador
704 descargas
Versión 1.0, Nov 2025
Windows, Mac
3.5
Valoraciones: 2
Descripción
Bloque de Orden ICT - Bloques de Orden Institucionales
Identifica automáticamente bloques de orden institucional en tus gráficos. Visualiza zonas clave donde el precio podría reaccionar.
Qué hace
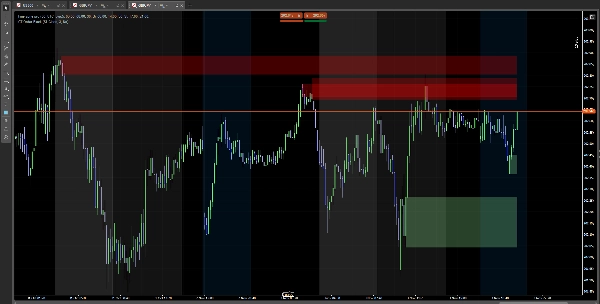
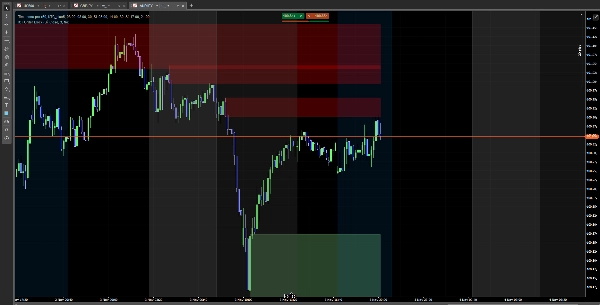
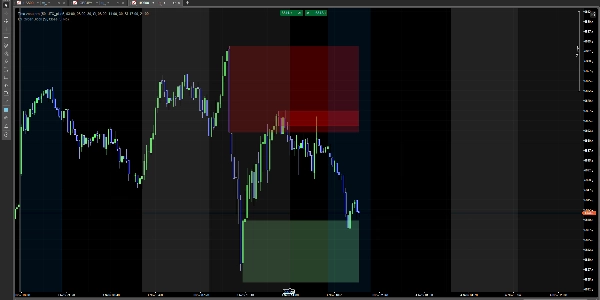
✅ Detecta bloques alcistas (zonas de compra institucional) ✅ Detecta bloques bajistas (zonas de venta institucional) ✅ Muestra rectángulos coloreados en zonas importantes ✅ Los bloques desaparecen cuando el precio los atraviesa
Cómo usarlo
Instalación sencilla
- Descarga el indicador
- Agrégalo a tu gráfico en cTrader
- ¡Listo! Verás los bloques automáticamente
Configuración
Configuración Principal
- Mostrar SCOB: Mostrar u ocultar bloques
- Método de Mitigación:
-
- Cierre: El bloque desaparece al cerrar la vela
- Mecha: El bloque desaparece al ser tocado
- Mostrar los últimos X SCOBs: Cuántos bloques mostrar (1-15)
- Aplicar filtro de volatilidad: Filtrar bloques según la volatilidad
Colores
- Color Alcista: Color para bloques alcistas (verde claro por defecto)
- Color Bajista: Color para bloques bajistas (rojo por defecto)
- Ajusta la transparencia con el selector de color
Interpretación
🟢 Bloques Verdes (Alcistas): Zonas potenciales de soporte 🔴 Bloques Rojos (Bajistas): Zonas potenciales de resistencia
Nota: Este es un indicador de análisis técnico. Úsalo con una gestión adecuada del riesgo.
Resumen
Resumen de IA
ICT Order Block is a technical analysis indicator designed for use on cTrader charts. It automatically identifies institutional order blocks, highlighting key price zones where market reactions may occur. The indicator detects bullish order blocks (potential institutional buying zones) and bearish order blocks (potential institutional selling zones), displaying them as colored rectangles—green for bullish support areas and red for bearish resistance areas. These blocks visually represent important supply and demand zones that traders can monitor.
Key features include automatic block detection, configurable display options such as the number of blocks shown (1–15), and a volatility filter to refine block selection. Users can choose how blocks disappear: either when a candle closes beyond the block or when the block is touched by price wicks. Color customization and transparency adjustments are also available for better chart integration.
Installation involves adding the indicator to a cTrader chart, after which the blocks appear automatically. This tool supports analysis across Forex, Indices, and Cryptocurrency markets. It serves as a visual aid for identifying potential support and resistance zones based on institutional trading activity and should be used alongside proper risk management practices.
Perfil del indicador
Valoraciones de clientes
3.5
Valoraciones: 2
5 | 50 % | |
4 | 0 % | |
3 | 0 % | |
2 | 50 % | |
1 | 0 % |
Valoraciones de clientes
January 27, 2026
the zones are blocking the candles, zones need to be behind the candles .other than that it is good
Conversación
Preguntas frecuentes
Forex
Indices
Crypto
Los productos disponibles a través de cTrader Store, incluidos bots, indicadores y plugins para operar, son proporcionados por desarrolladores de terceros y están disponibles únicamente con fines informativos y de acceso técnico. cTrader Store no es un bróker, por lo que no proporciona asesoramiento de inversión, recomendaciones personales ni ninguna garantía de rentabilidad futura.


Precio
Desde 24/02/2025
15
Ventas
1.81K
Instalaciones gratis