
ICT Order Block
지표
861 다운로드
버전 1.0, Nov 2025
Windows, Mac
3.5
리뷰: 2

가입일 24/02/2025
18
판매
2.19K
무료 설치
설명
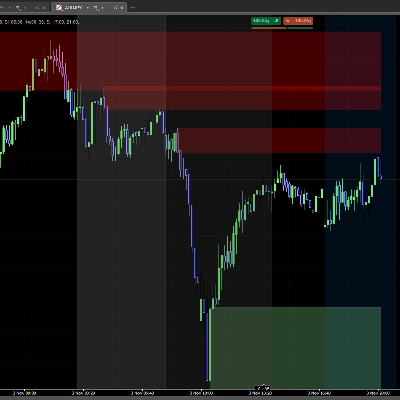
ICT 주문 블록 - 기관 주문 블록
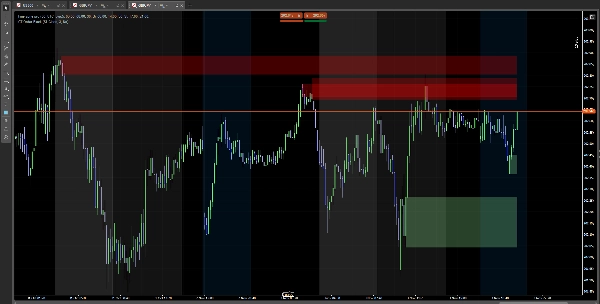
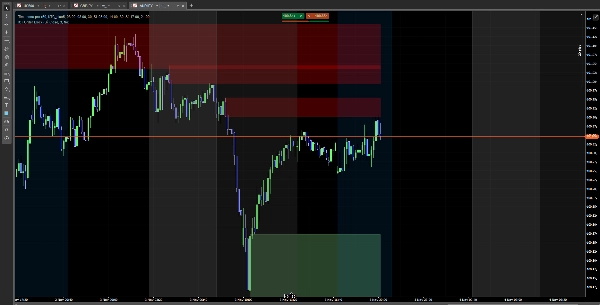
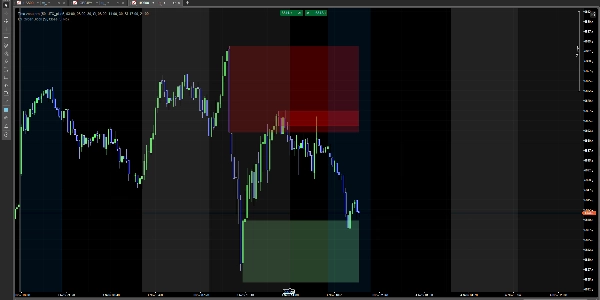
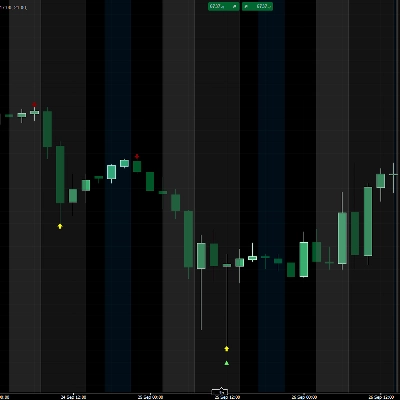
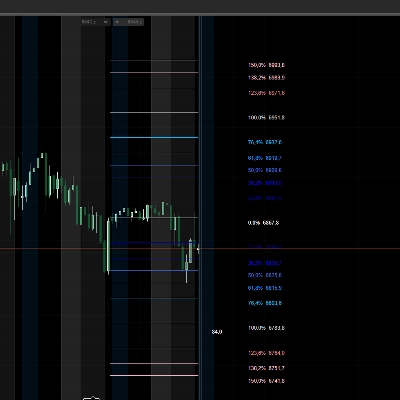
차트에서 기관 주문 블록을 자동으로 식별합니다. 가격이 반응할 수 있는 주요 구역을 시각화합니다.
기능
✅ 강세 블록(기관 매수 구역) 감지 ✅ 약세 블록(기관 매도 구역) 감지 ✅ 중요한 구역에 색상 사각형 표시 ✅ 가격이 돌파하면 블록 사라짐
사용 방법
간단한 설치
- 지표 다운로드
- cTrader 차트에 추가
- 완료! 블록이 자동으로 표시됩니다
설정
주요 설정
- SCOB 표시: 블록 표시 또는 숨기기
- 완화 방법:
-
- 종가: 캔들 종가 시 블록 사라짐
- 꼬리: 닿으면 블록 사라짐
- 마지막 X개 SCOB 표시: 표시할 블록 수 (1-15)
- 변동성 필터 적용: 변동성 기준 블록 필터링
색상
- 강세 색상: 강세 블록 색상 (기본 연두색)
- 약세 색상: 약세 블록 색상 (기본 빨간색)
- 색상 선택기로 투명도 조절
해석
🟢 녹색 블록 (강세): 잠재적 지지 구역 🔴 빨간색 블록 (약세): 잠재적 저항 구역
참고: 이것은 기술적 분석 지표입니다. 적절한 위험 관리와 함께 사용하세요.
요약
AI summary
ICT Order Block is a technical analysis indicator designed for use on cTrader charts. It automatically identifies institutional order blocks, highlighting key price zones where market reactions may occur. The indicator detects bullish order blocks (potential institutional buying zones) and bearish order blocks (potential institutional selling zones), displaying them as colored rectangles—green for bullish support areas and red for bearish resistance areas. These blocks visually represent important supply and demand zones that traders can monitor.
Key features include automatic block detection, configurable display options such as the number of blocks shown (1–15), and a volatility filter to refine block selection. Users can choose how blocks disappear: either when a candle closes beyond the block or when the block is touched by price wicks. Color customization and transparency adjustments are also available for better chart integration.
Installation involves adding the indicator to a cTrader chart, after which the blocks appear automatically. This tool supports analysis across Forex, Indices, and Cryptocurrency markets. It serves as a visual aid for identifying potential support and resistance zones based on institutional trading activity and should be used alongside proper risk management practices.
Key features include automatic block detection, configurable display options such as the number of blocks shown (1–15), and a volatility filter to refine block selection. Users can choose how blocks disappear: either when a candle closes beyond the block or when the block is touched by price wicks. Color customization and transparency adjustments are also available for better chart integration.
Installation involves adding the indicator to a cTrader chart, after which the blocks appear automatically. This tool supports analysis across Forex, Indices, and Cryptocurrency markets. It serves as a visual aid for identifying potential support and resistance zones based on institutional trading activity and should be used alongside proper risk management practices.
지표 프로필
고객 리뷰
3.5
리뷰: 2
5 | 50 % | |
4 | 0 % | |
3 | 0 % | |
2 | 50 % | |
1 | 0 % |
고객 리뷰
January 27, 2026
the zones are blocking the candles, zones need to be behind the candles .other than that it is good
상담
자주 묻는 질문(FAQ)
Forex
Indices
Crypto
트레이딩 봇, 지표, 플러그인 등 cTrader Store에서 제공되는 상품은 제3자 개발자에 의해 제공되며, 이는 단순히 정보 및 기술적 접근을 목적으로 제공된 것입니다. cTrader Store는 중개인이 아니며, 투자 조언, 개인별 추천 또는 향후 성과에 대한 어떠한 보장도 제공하지 않습니다.






















가격
가입일 24/02/2025
18
판매
2.19K
무료 설치